Features
Historical BSM Health Indicator
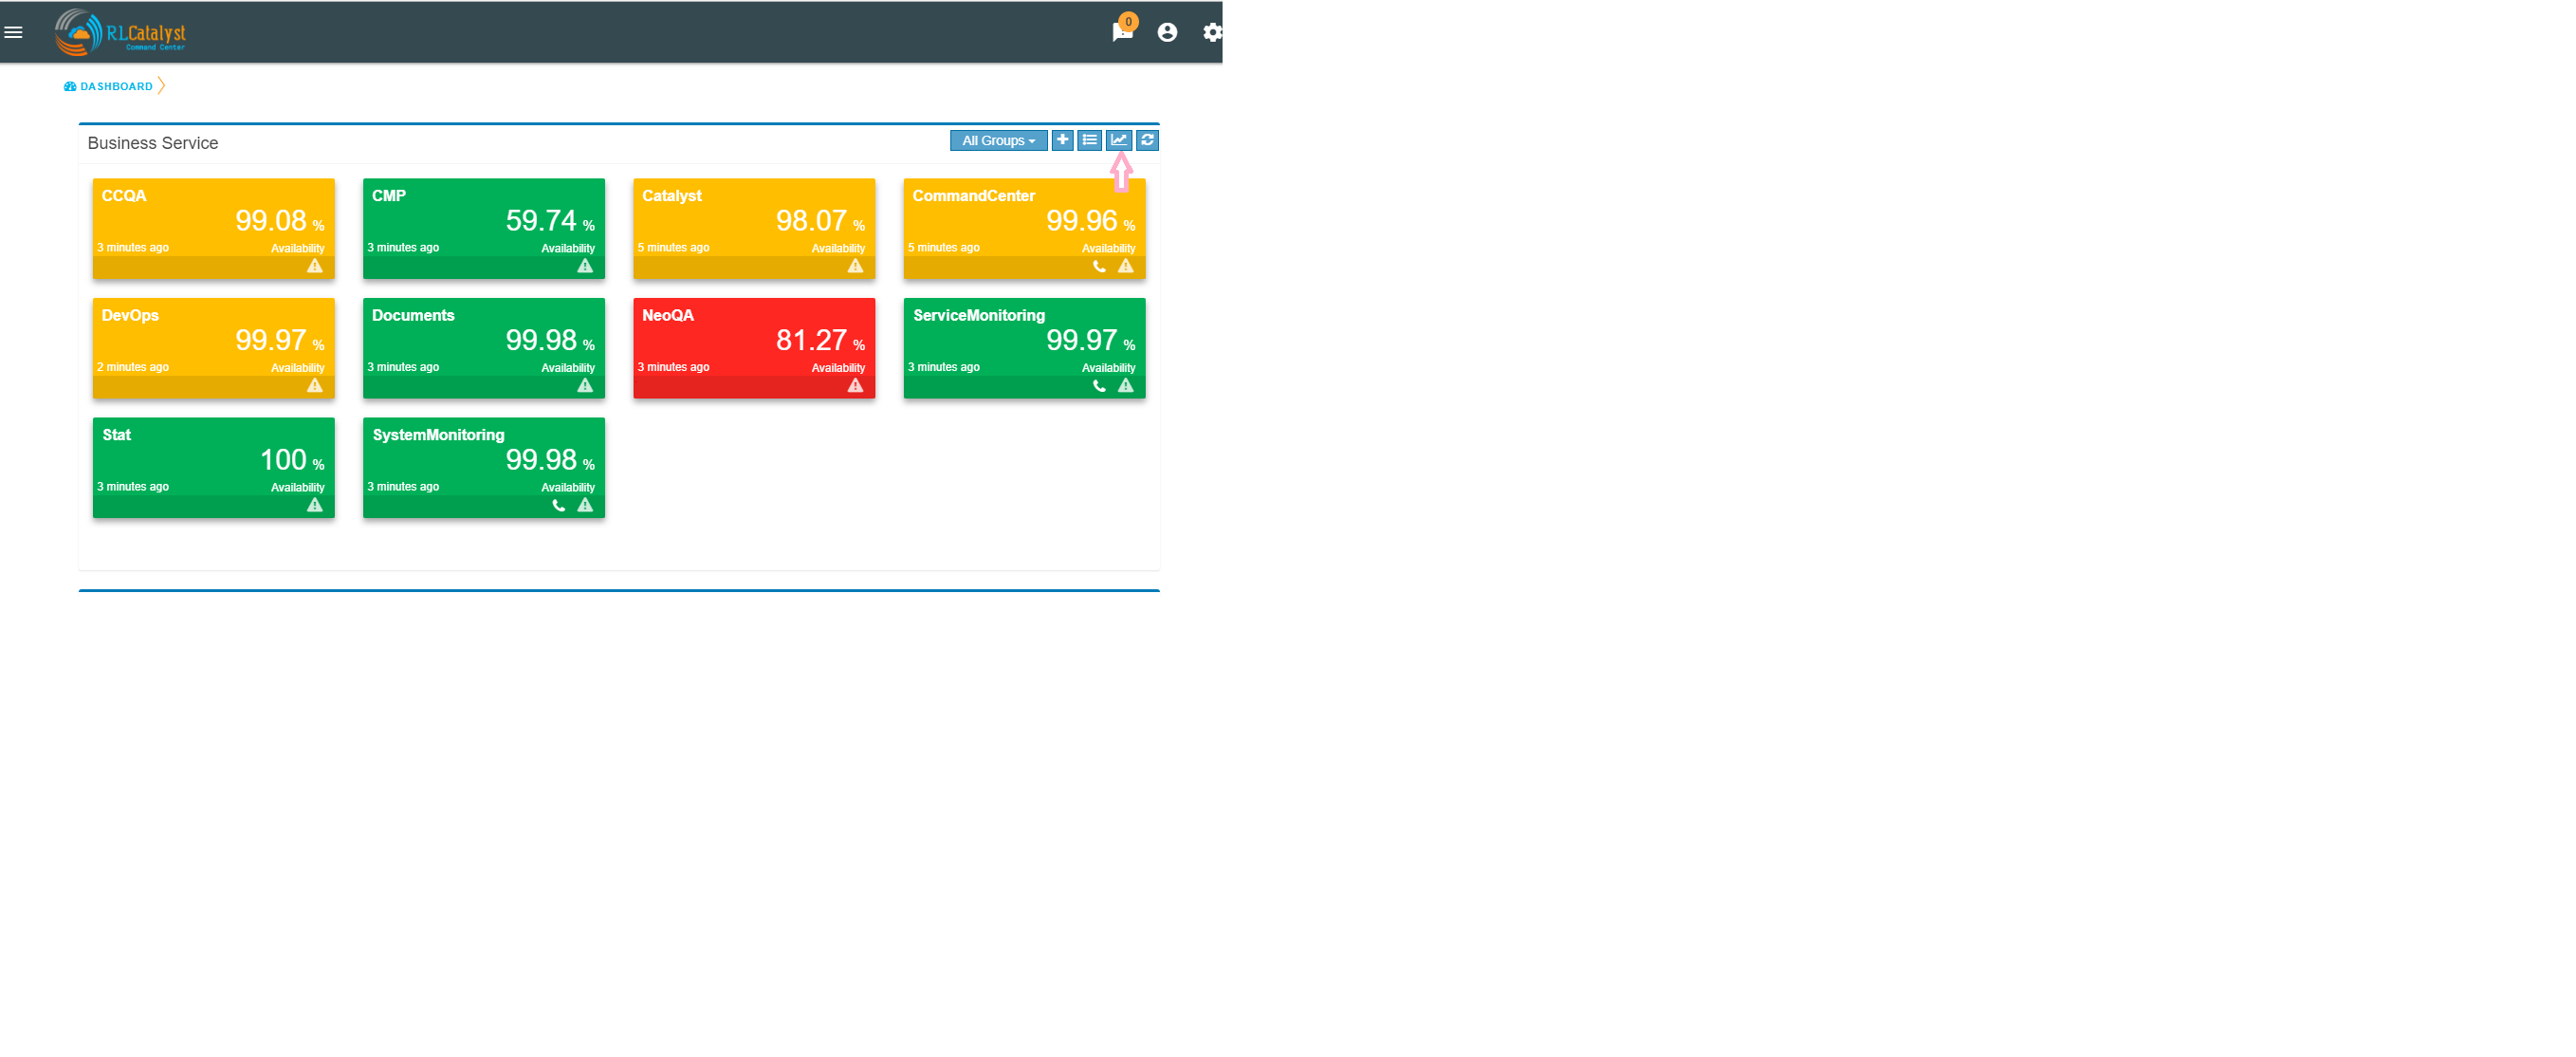
Historical BSM Health Indicator gives you the ability to see the trend of the BSM over last 30 days as a consolidated view. Using this view, the user can then navigate to specific outage view of interest..
The view can be available with a Trend Icon on Top-Left of BSM View and clicking that can show the Consolidated status of all BSM over last 30 days with appropriate status.
There is tab like “Business Services” in the main page.When we click on that tab,it’s navigated to Business services page.In that page we see the bot’s summary information,snow tickets information etc….

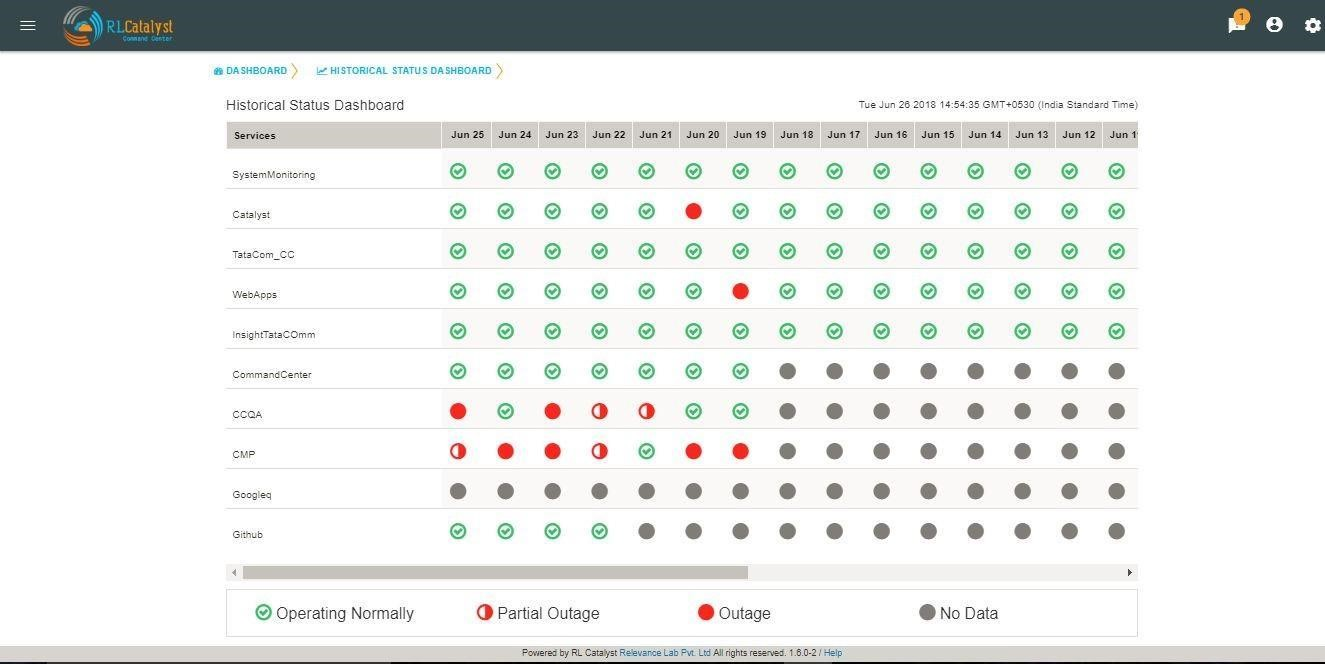
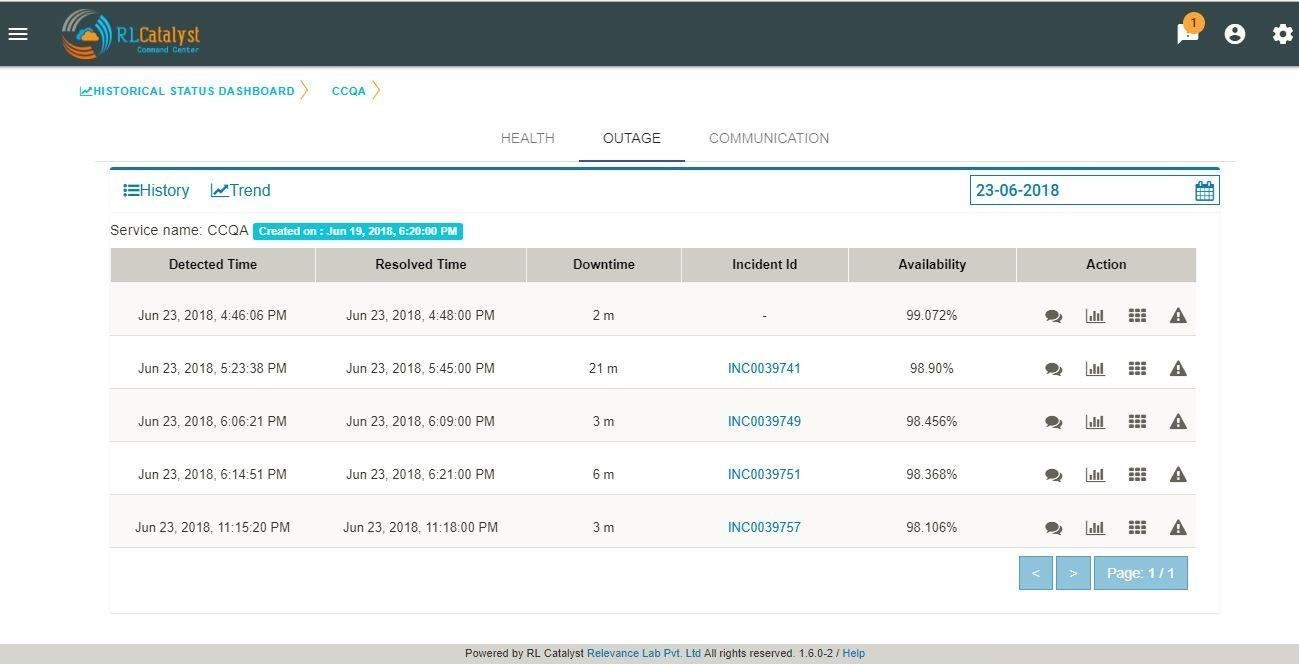
Clicking the link of Outage (Red) or Partial Outage available in the Historical Status Dashboard will take the user to the appropriate Outage Drill-down page
Multi-level Business Service
Multi-level Business Service feature will show the Dependent Business services(Linked Business Services) of the Business Service. User can provide any Business service as Dependent Business service of another Business Service. Whenever dependent Business Service went down the parent Business Service also shown as Yellow.
Configuration
User will provide the Dependency between Business Service using Yaml file. The Yaml file should follow the following rules.
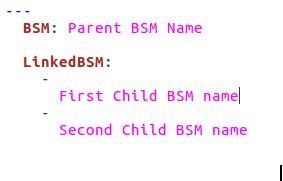
- File Name should be in the following order <tenantID>.<BSM Name>.yml.
- The YAML file should contain Parent BSM and their linked BSM’s
- Once the YAML is complete it should be added to the topologies folder.
- Then the scheduler server should be restart to refresh all the topologies picked from the file.
The dendent Business service will show in the topology(Graphical view and List View) and quick view topology.
Viewing Cloud Assets
- From the menu at the top left of the top bar, choose CMDB. Cloud assets will be listed once the Cloud Credentials are added in Settings. From the dropdown choose the cloud account and get the summary view and list view as shown in screenshot. The CMDB lists the following:
- Virtual machines
- Disks
- Security Groups
- Network Cluster
- Compute Databases
- Load Balancers
If the assets are tagged, the same information will be fetched into CMDB also. You can filter the CMDB assets view by clicking on buttons “All, Running, Monitoring “ which is available in the right corner just above the table. By default, ALL filter should be selected.
ALL: displays all the nodes (Active & Inactive)
.jpg)
Running: displays all the running nodes
.jpg)
Monitoring: displays the monitoring nodes health services, Node, ELK Log Icons. Clicking on Services, Node & ELK Log Icons shall take the user to respective pages.
.jpg)
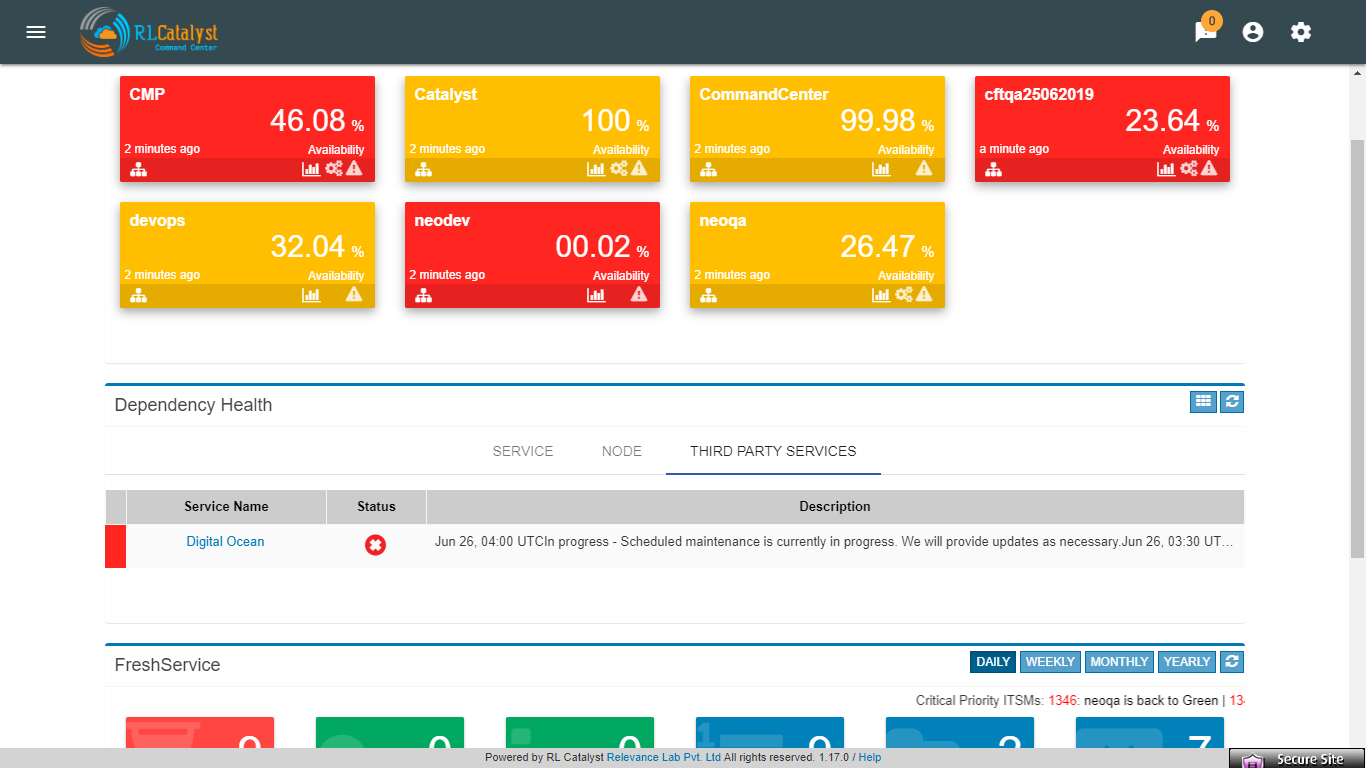
RSS-Feed for cloud providers
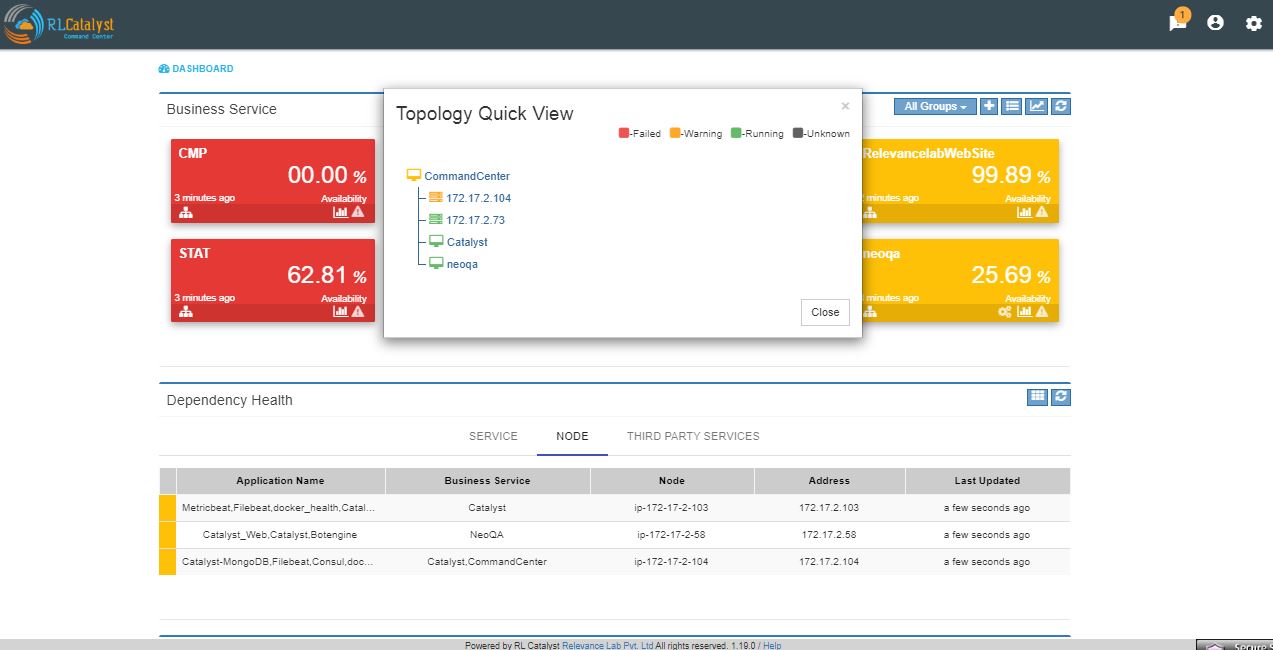
A new tab Third party tab will be displayed in Dependency Health panel, which will monitor the cloud provider status which tenant has added in the provider settings.
Aggregated Alerts
Once the services are added and agents are installed, the alerts will be aggregated from multiple monitoring sources by the respective collectors. Alerts are currently aggregated from
- Ping BOTs – Checks Availability of Services
- Consul – Monitors Services
- Sensu – System Monitoring
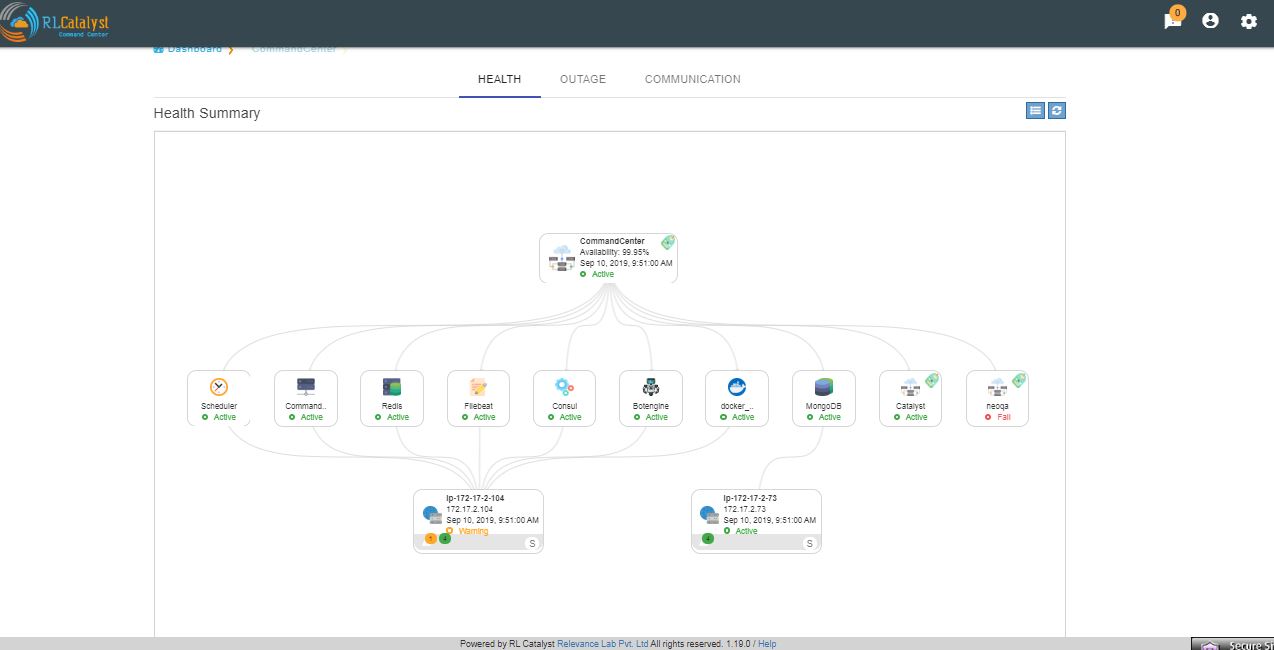
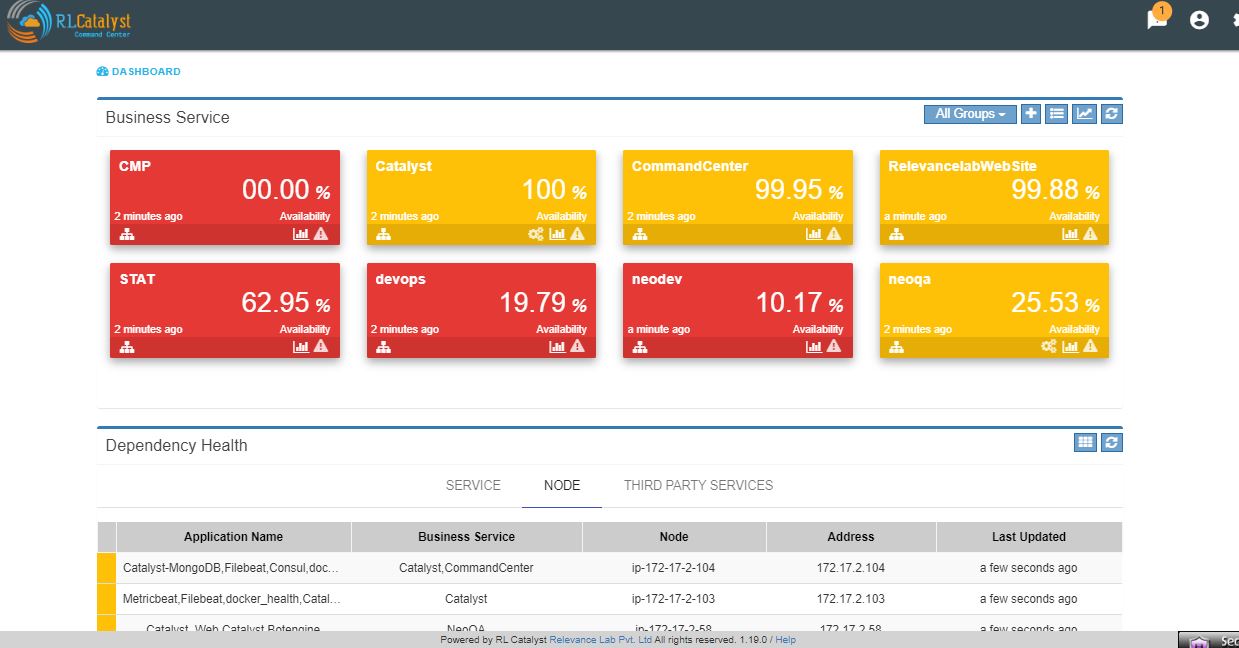
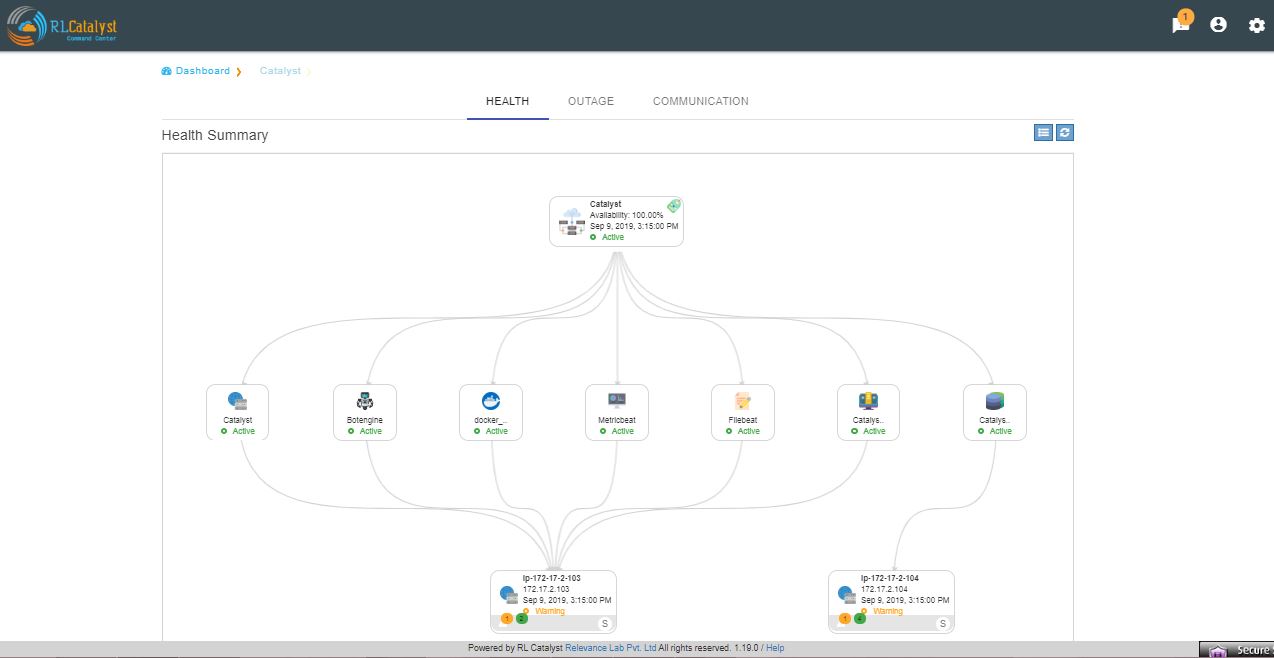
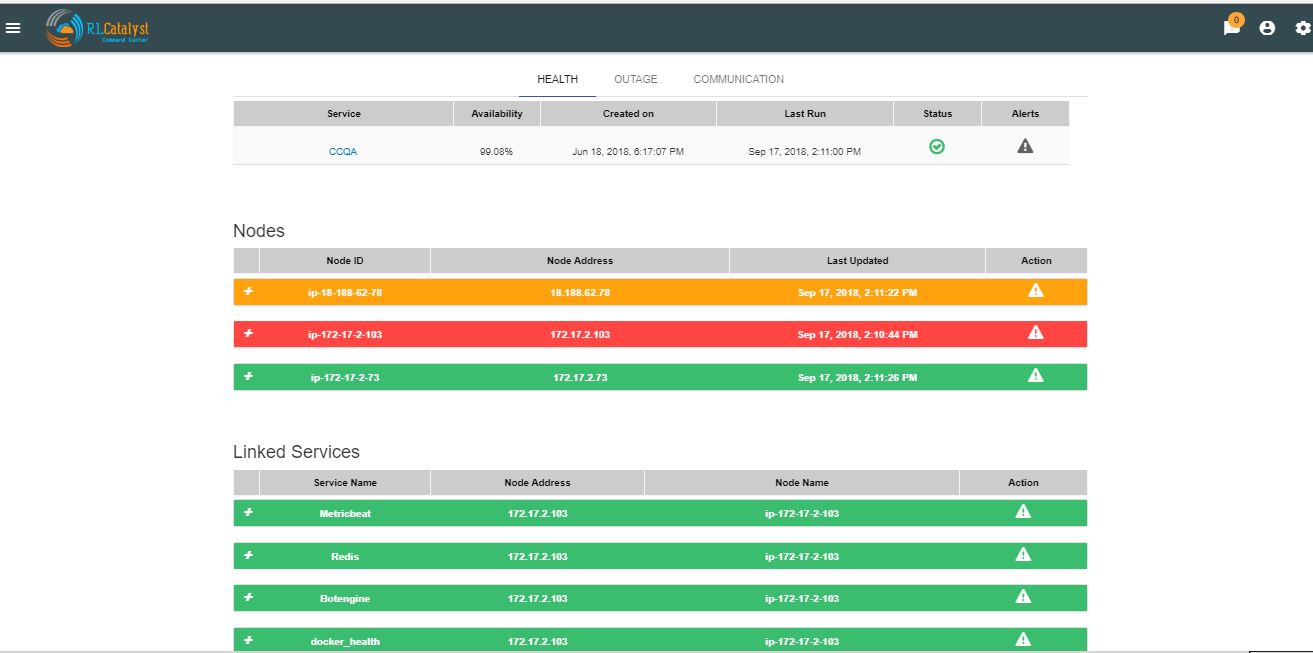
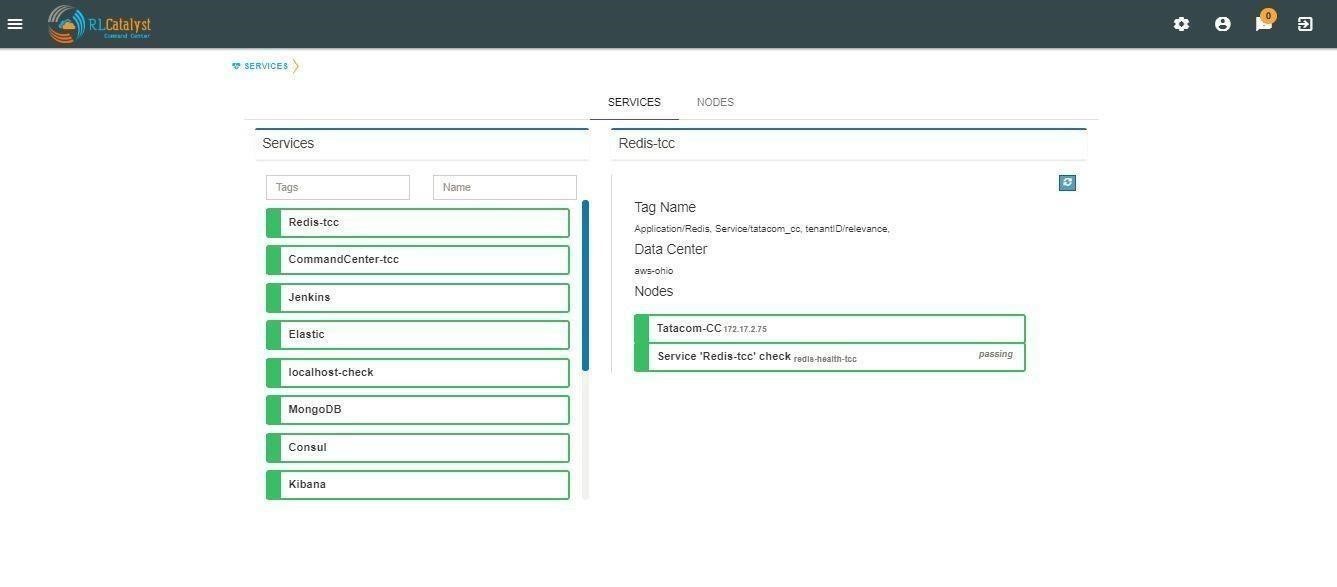
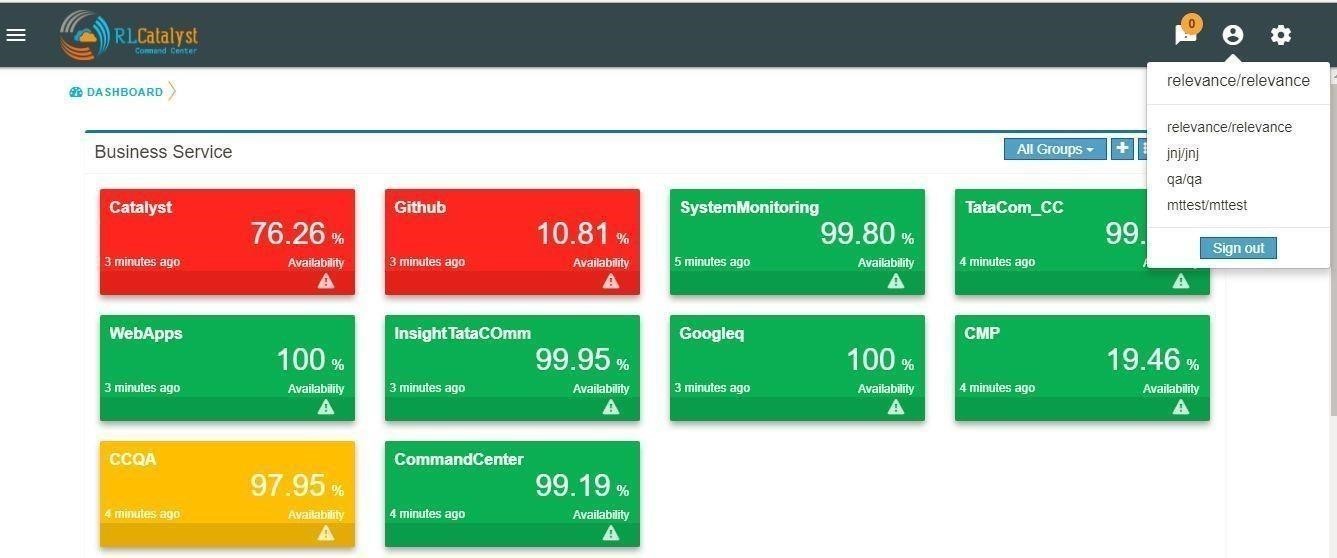
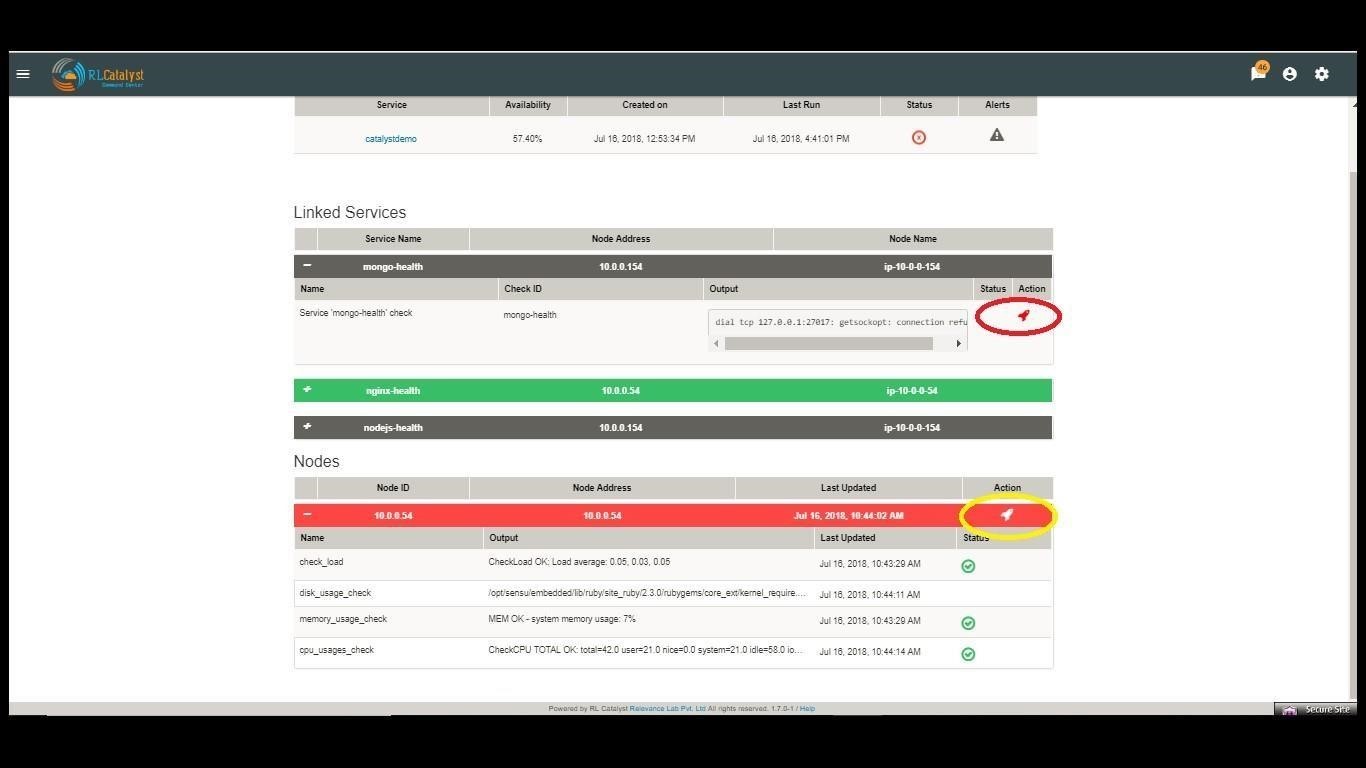
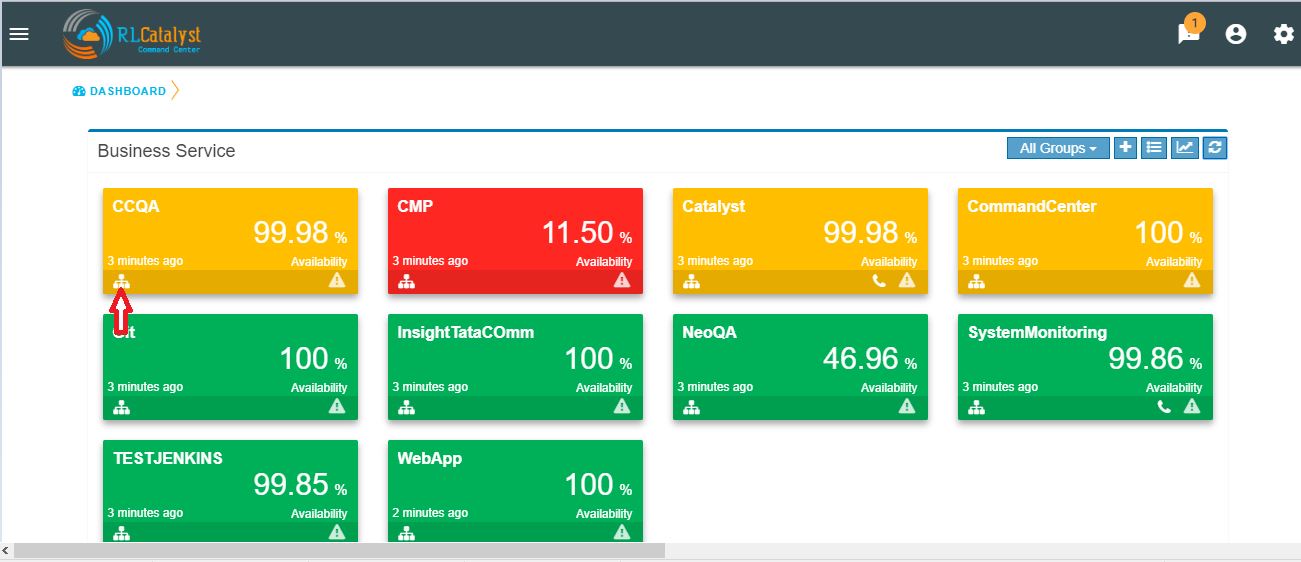
When the service goes down or if an Outage happens, the corresponding card on the dashboard view will turn Red. When any of the dependent services has a problem related to BSM will be Yellow. Clicking on the card will give details on linked services and the associated nodes
Here the details of linked services and the associated nodes of a particular BSM is shown in a graphical representation.
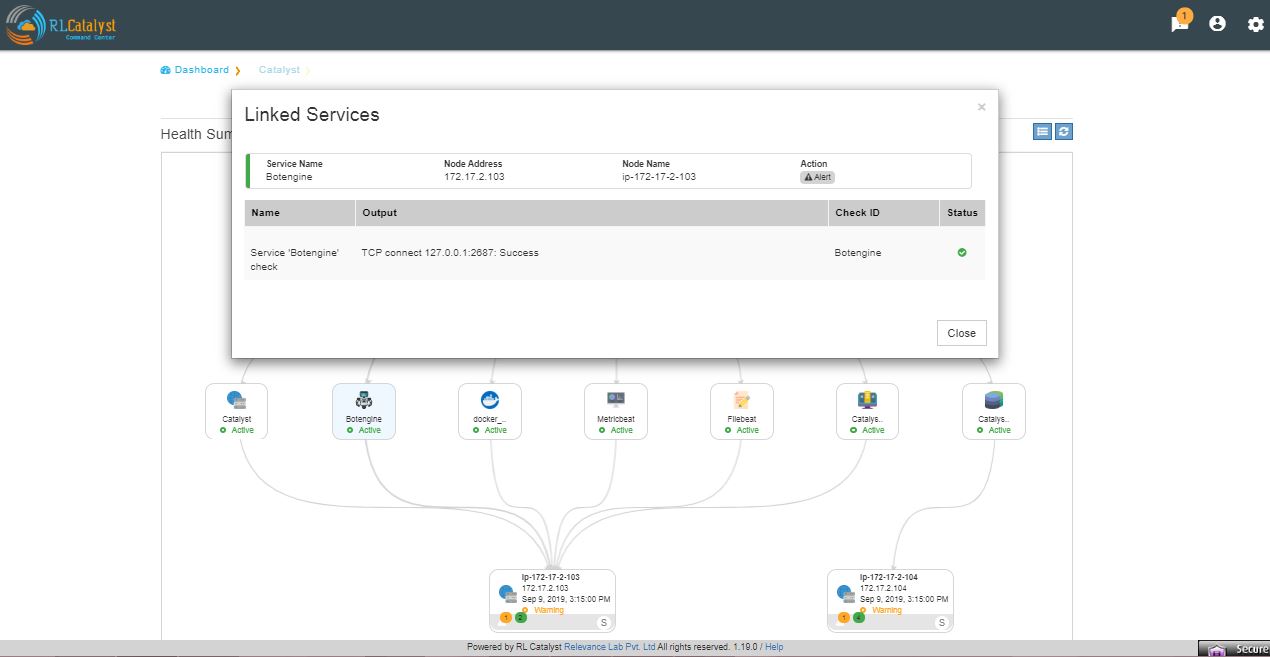
clicking on each box in the graphical view will pop-up and shows the details of that particular thing in a detailed manner.
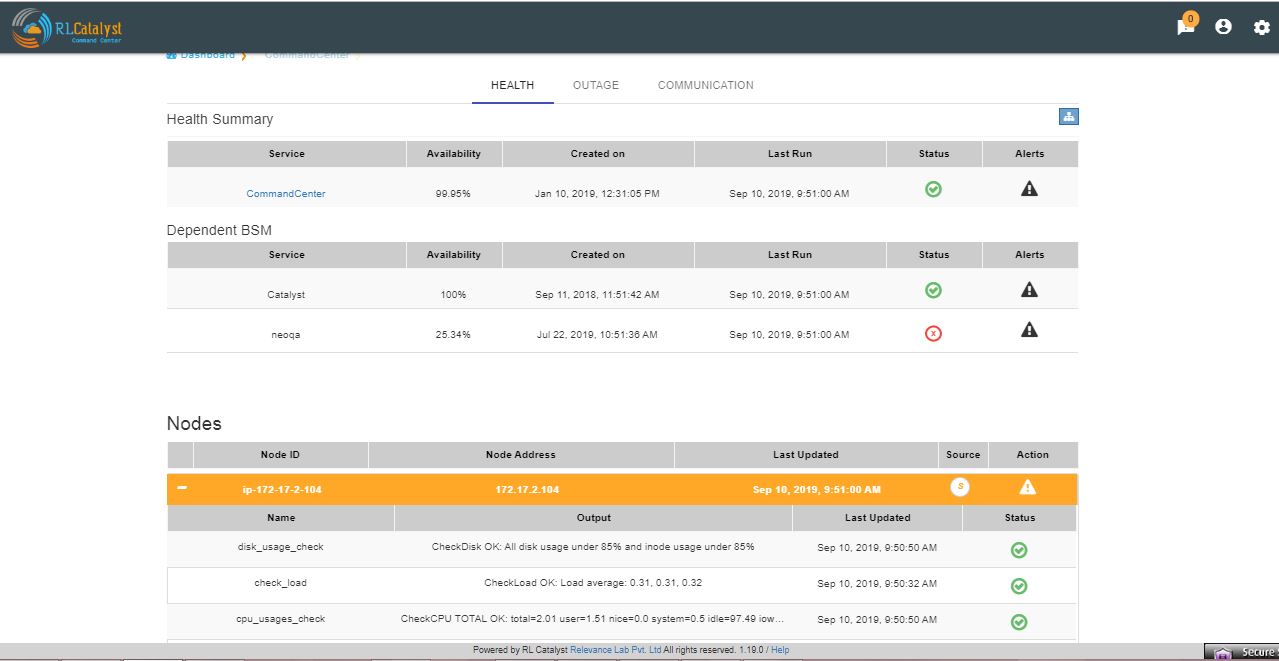
At the top right corner, you can see a button which gives us an another option of viewing the details of linked services and asociated nodes for a particular BSm in a listed view.
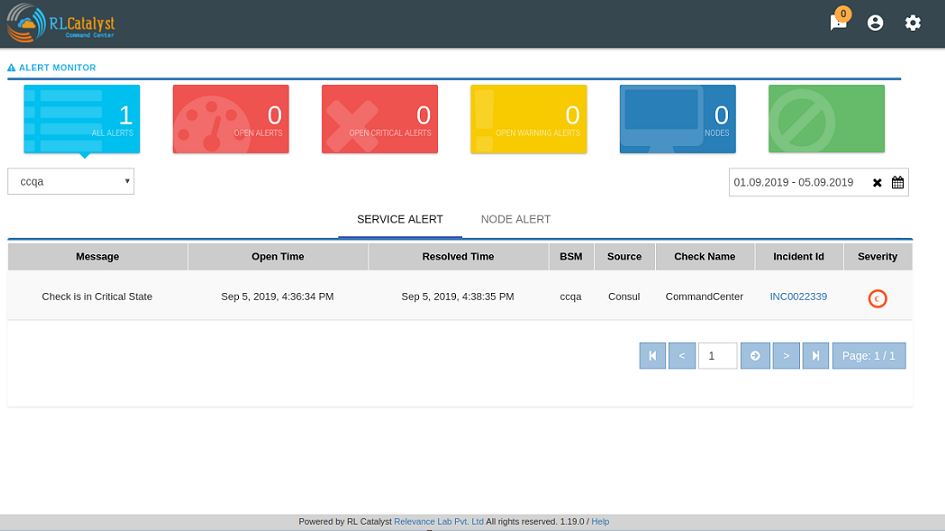
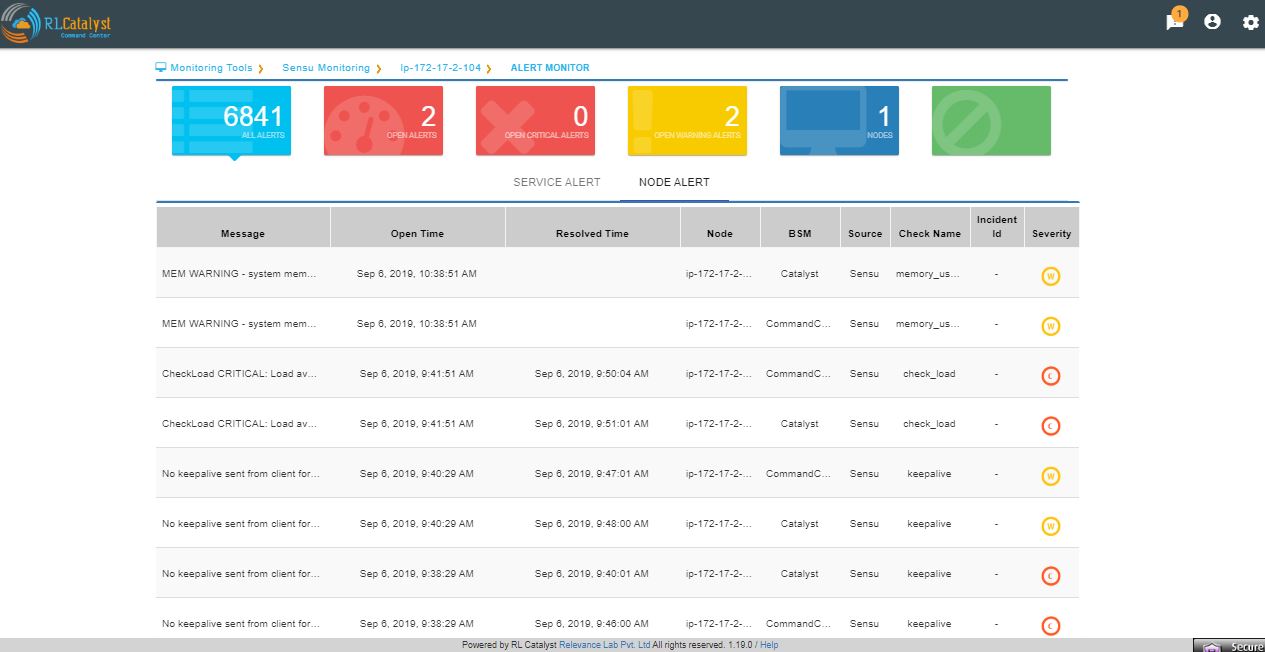
Click on the Alerts button to see the detailed Alerts from multiple sources (Pingbot, Consul & Sensu). Alerts aggregated by Node or Service in the Alerts Monitor screen.
Service alerts are shown on the Services tab of the Alert Monitor.
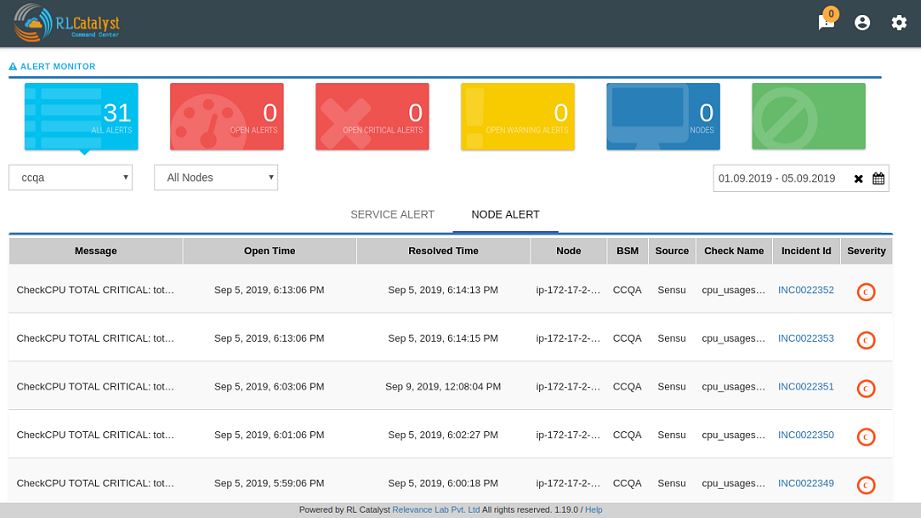
System alerts are shown in the Nodes tab of the Alert Monitor.
The dependent services of the Business Service and their health can be viewed under the Linked services section of the same page.
The dependent nodes of the Business Service and their health can be viewed under the Nodes section of the same page.
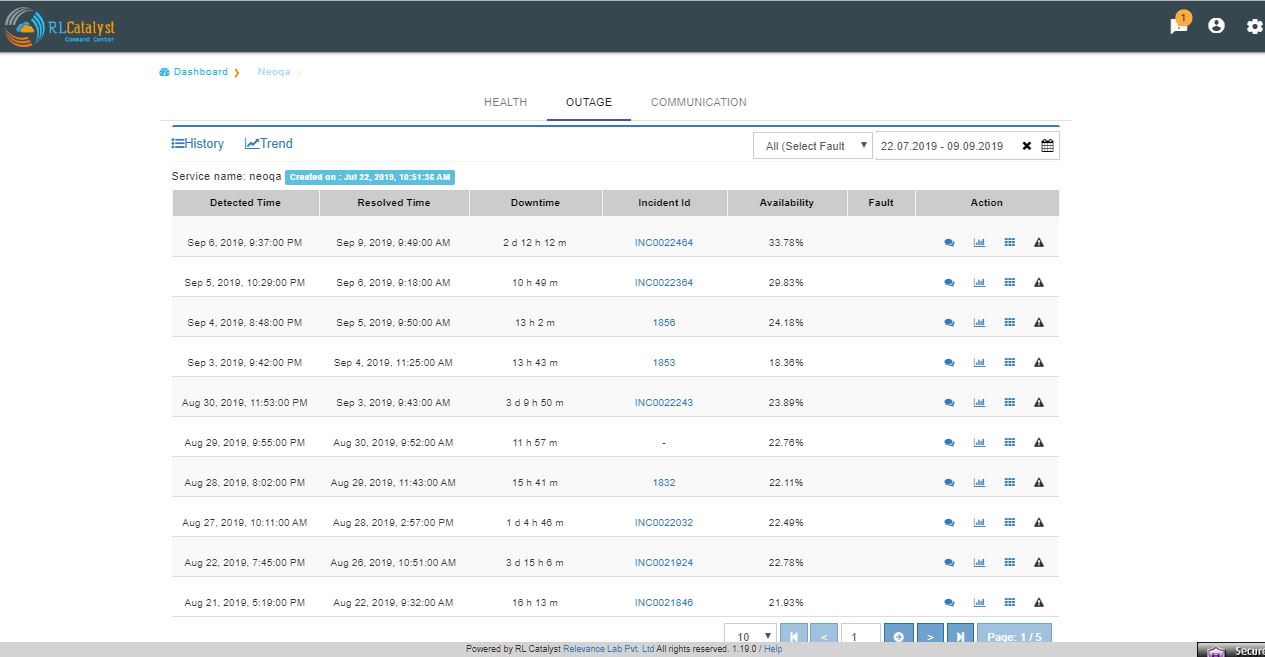
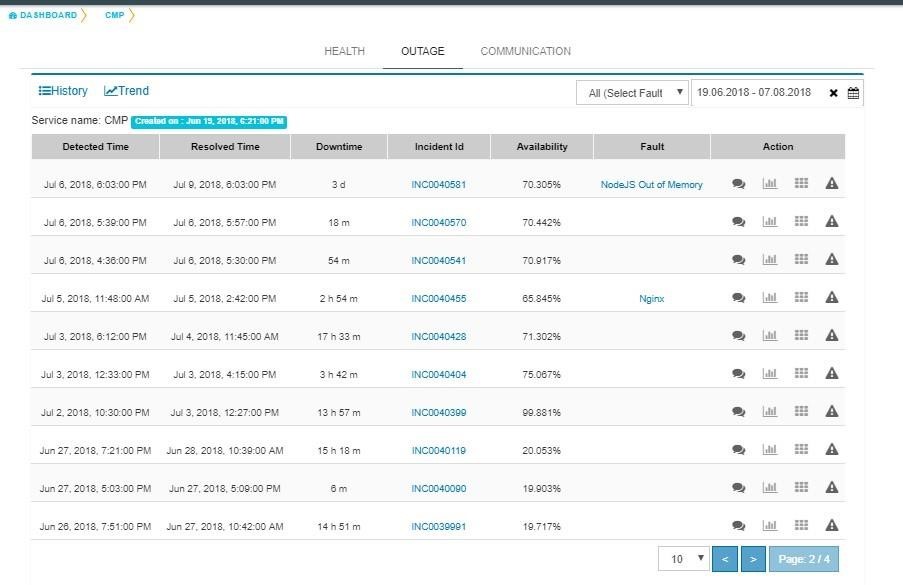
Click on the Outages tab to get a detailed list of all the outages detected by the system.
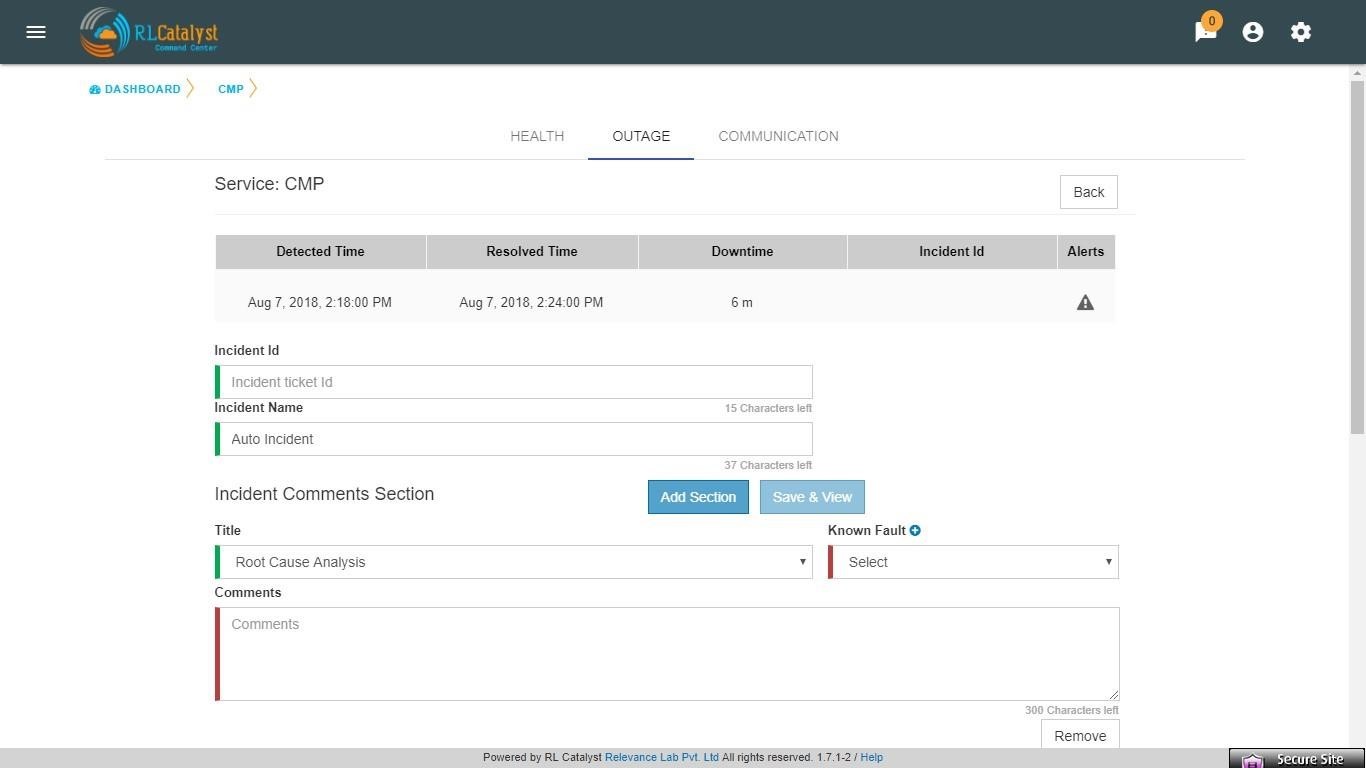
Incident Communication
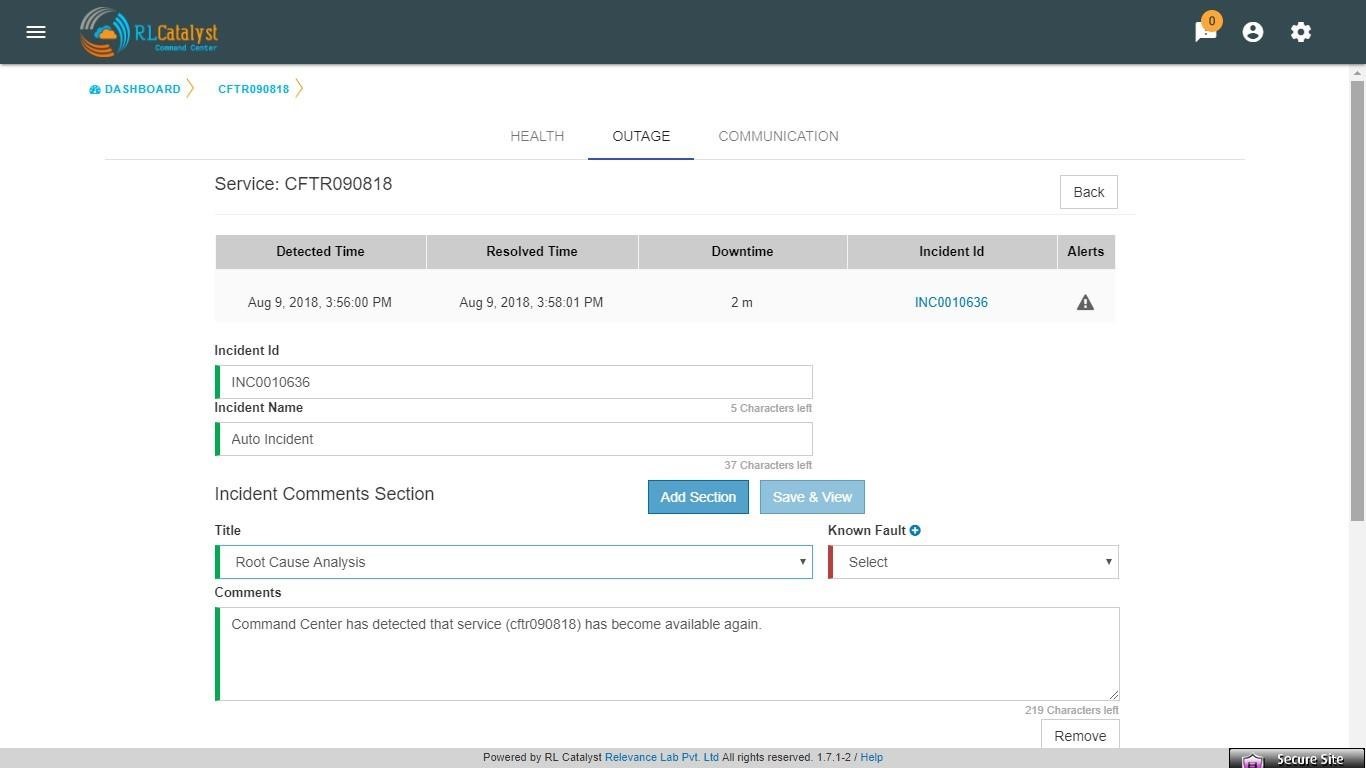
Click on the Incident Id to open the associated ServiceNow ticket on the ServiceNow portal. Click on the Incident Communication icon to send out communication about the incident with Root Cause Analysis & Category.
.jpg)
Auto-create Incident Communications for Detection and Resolution :
System automatically creates Incident Communication for application outage detection and resolution.
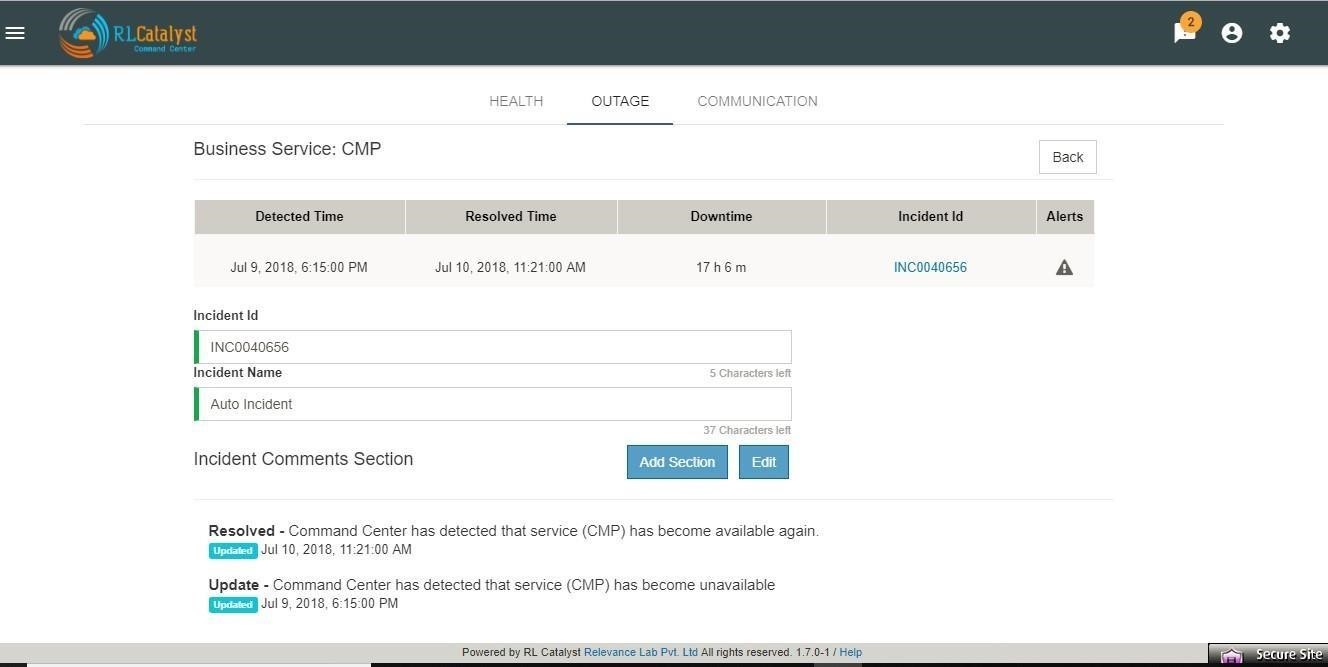
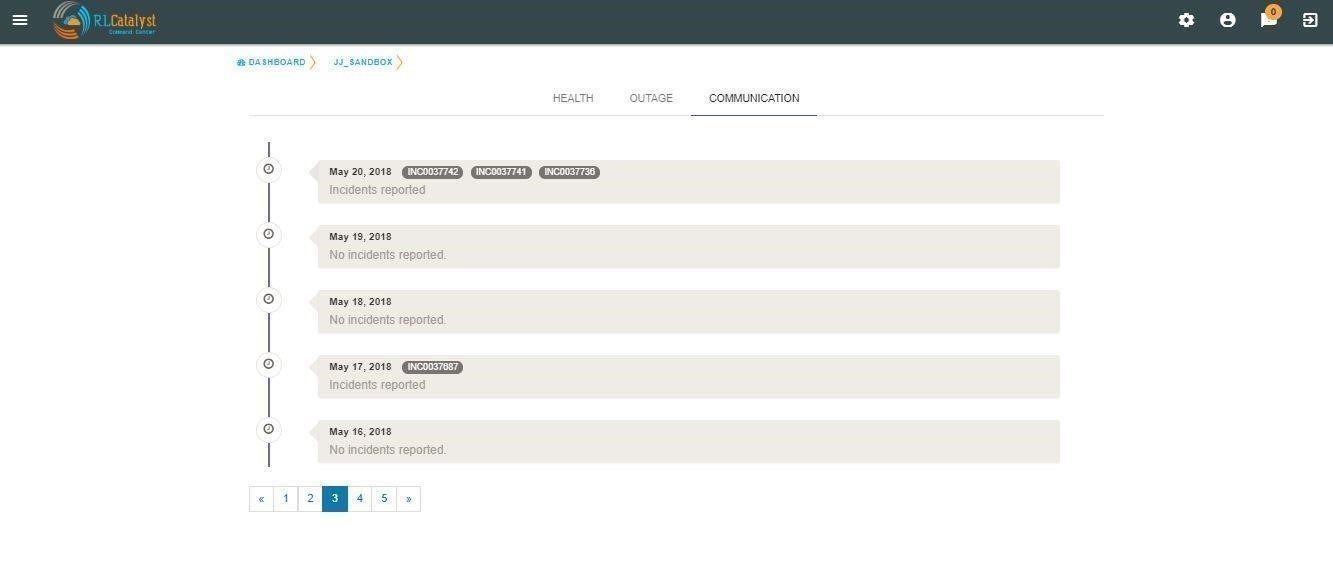
Click on the Communications tab to see a timeline of incidents
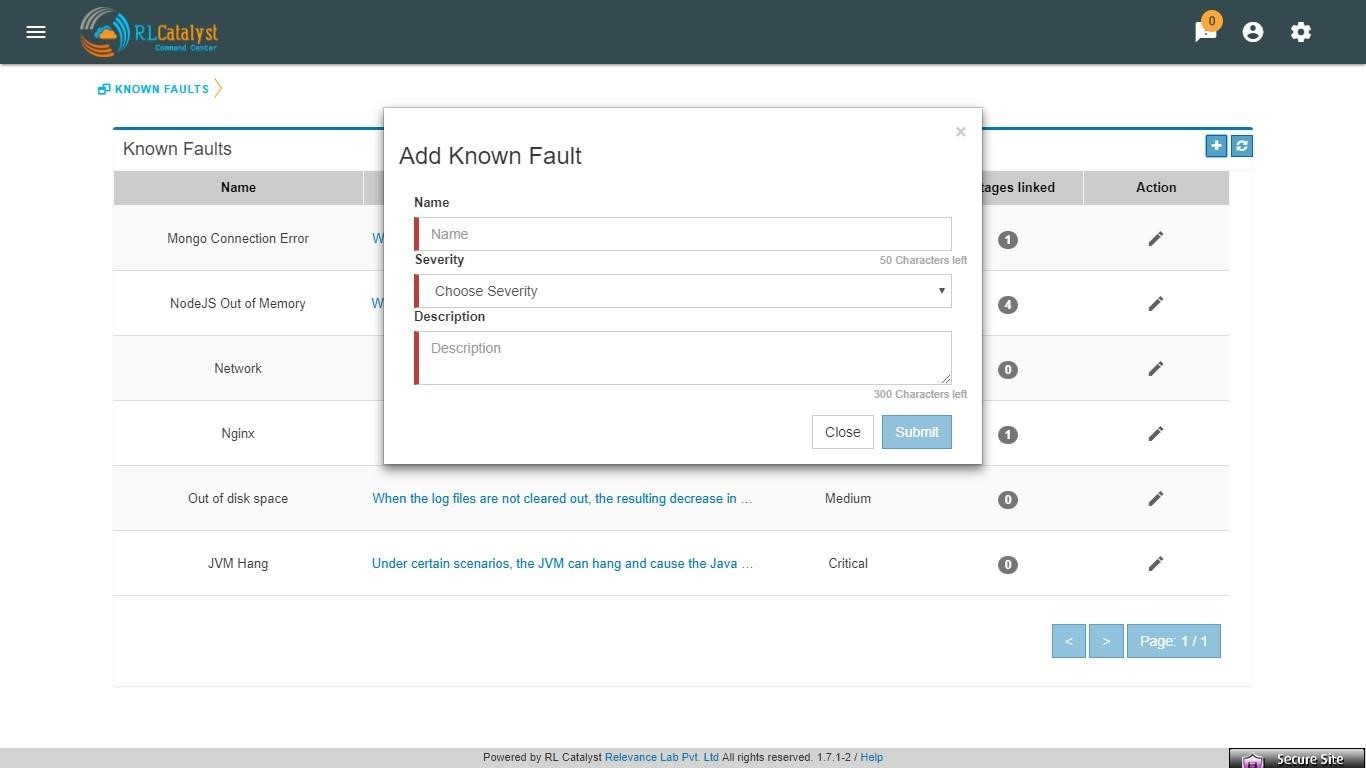
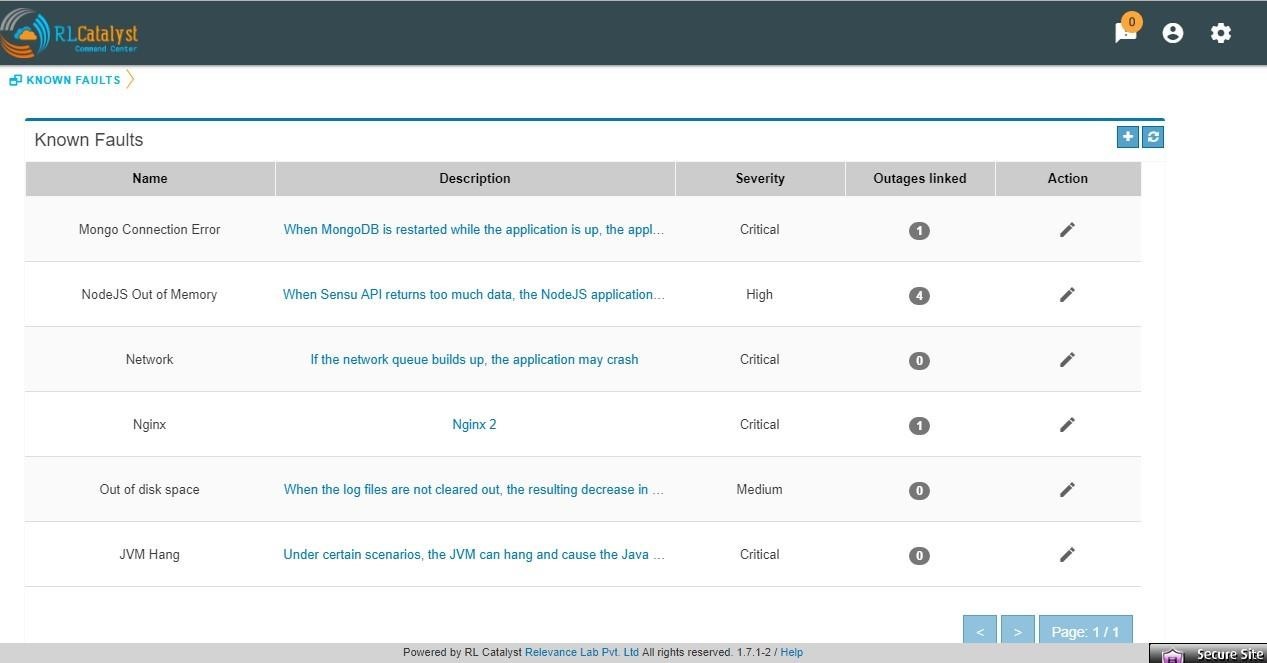
Command Center provides a feature called “Fault Table” to capture known problems related to a service and then uses the information to help the user to categorize the root-cause of any outage that occurs.
User can add fault to “Fault Table” by clicking on + icon which is available in the “Known Faults” table (Menu->Known Faults link-> + icon)
When a Root-cause identified incident communication is entered, the user can link the RCA Incident Communication to an item in the Fault Table associated to the BSM through Add Incident Communication screen.
User shall be able to navigate to the Fault Table from any outage which is linked to a fault by clicking on “Fault” link in the Outages screen.
User can view the count of outages linked to a fault by clicking on the “Outages Linked” link in the Fault table
Aggregated Alerts for all services are available from the left pane menu ‘Services’.
Aggregated Alerts for all servers/instances are available from the left pane menu ‘Monitoring Tools’
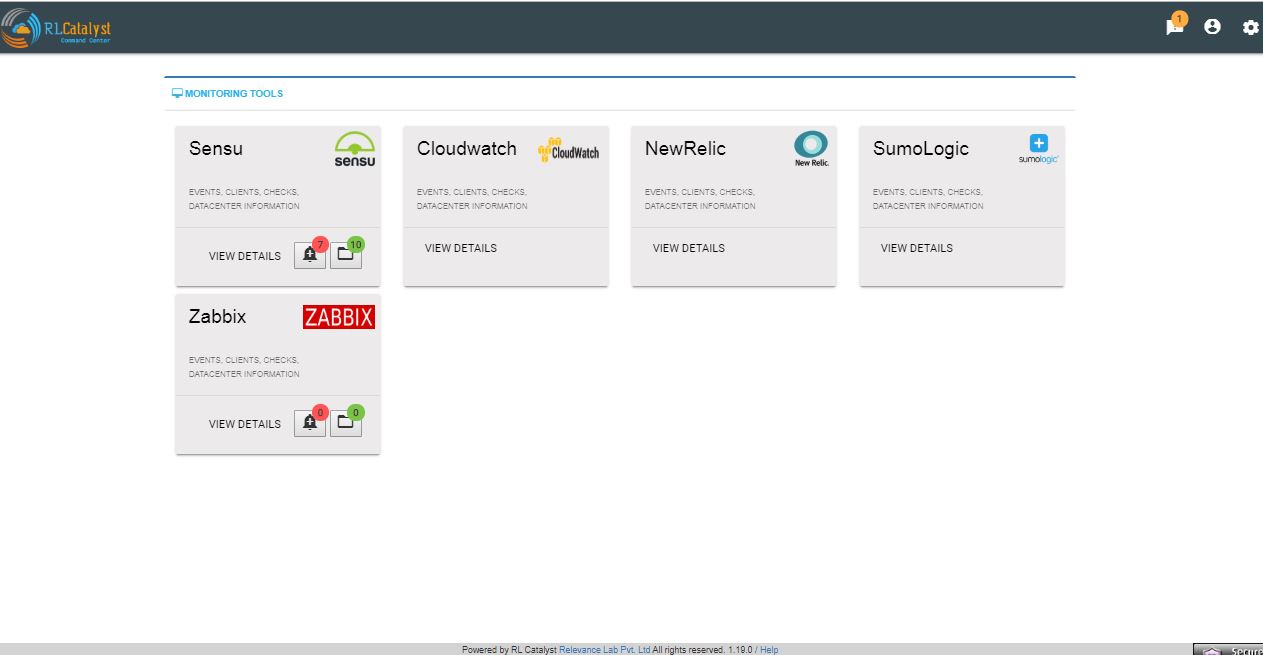
History for all servers/instances are available from the Monitoring Tools->Clients->History
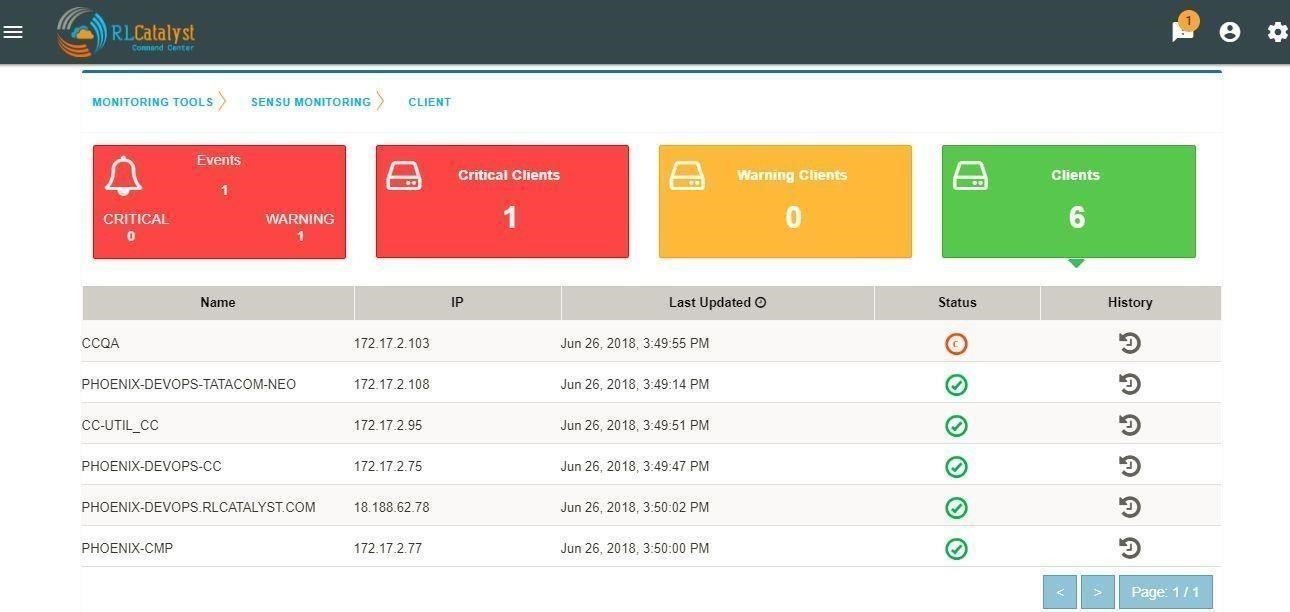
Click on History Icon, to view the detailed history information regarding each client
Logging in as a landlord
Open a browser (we recommend Chrome or Firefox). Enter the application URL provided. The login page should open. On the login page, fill the Company, User and Password fields as captured in Appendix A. Then click the Login button. You will see the landing page of the tenant created first and by choosing the tenant be able to view the data of that tenant.
Remediation
Command Center allows you to restart the service if a problem is encountered either at an underlying Node level or at a dependent service level. This feature is to give L0/L1 level support personnel a quick means of attempting to correct a problem.
When a dependent node/service has a critical alert, you have an option to remediate the problem by clicking on the icon to restart the service which is available in the BSM drilldown view screen. The BOT would then restart the node.
Auto Remediation
Command Center allows you to choose to configure certain Business Services (Managed Nodes) for auto healing. Whenever an outage is detected for a BSM configured with auto-healing, the system shall then kick-off the auto-remediation process. Auto-healing shall be initiated for nodes provided are in warning or critical status.
Manual remediation shall not be available for Nodes under a BSM that is enabled for Auto-healing.
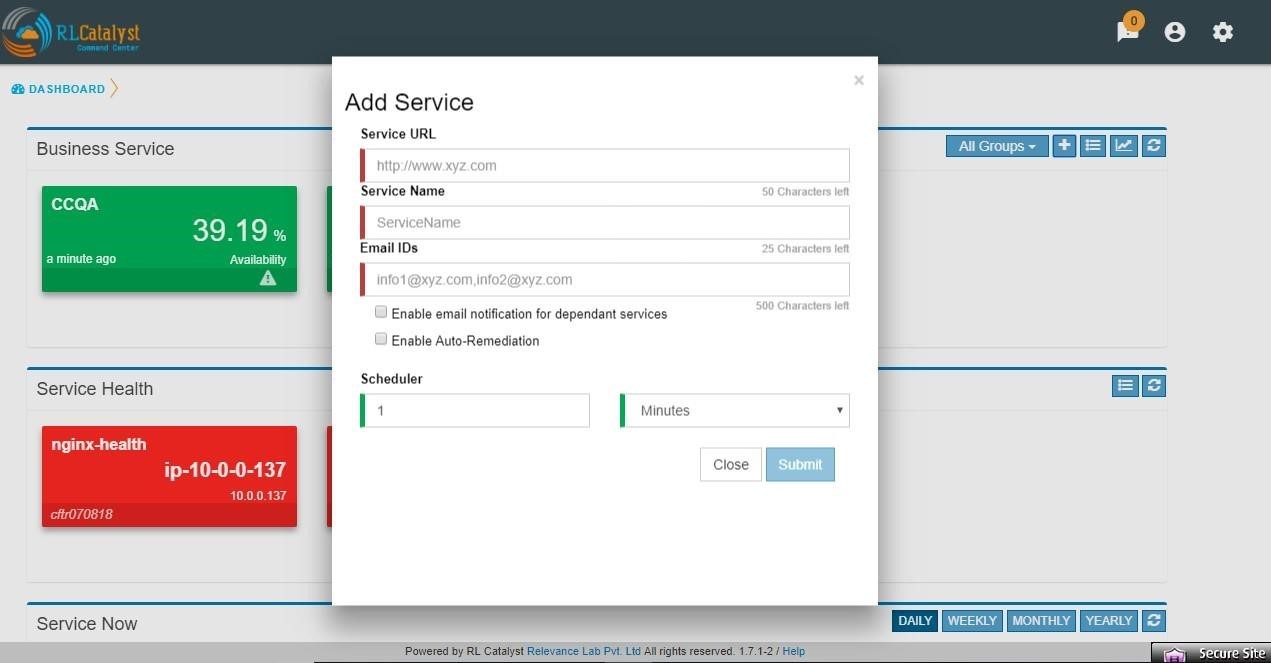
You can opt for Auto-healing option by checking the Checkbox “Enable Auto-Remediation” which is available in the “Add Service” screen.
Planned versus Unplanned outages
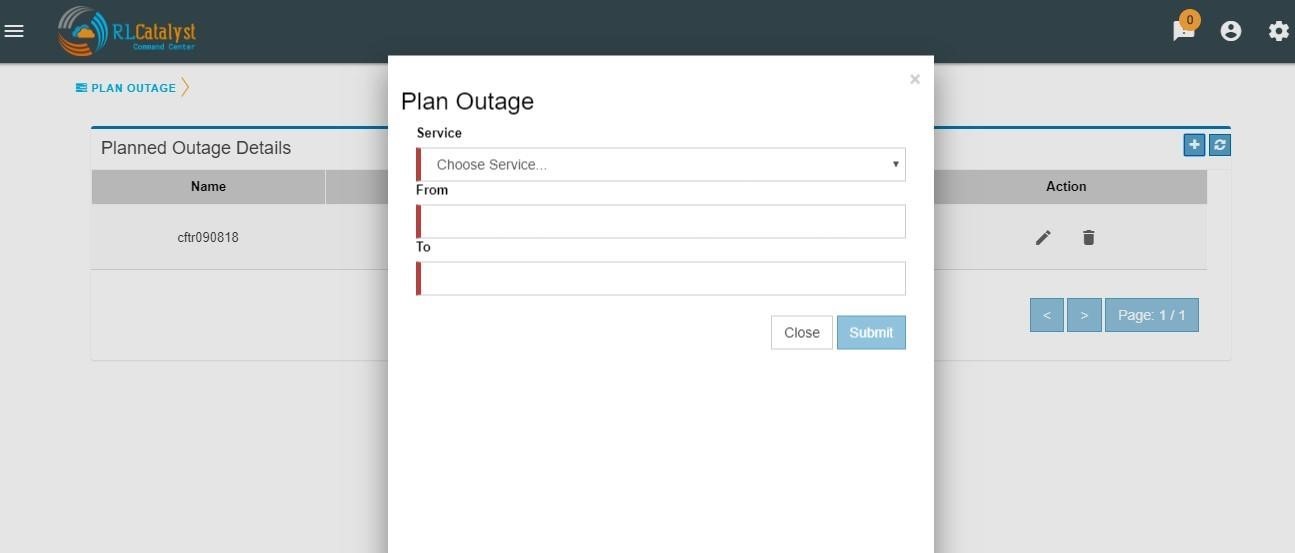
The idea of this feature is to provide a capability to plan a down-time so that the availability of the Business Service shall not be affected. CommandCenter has provided a screen to enter a planned outage. This screen shall take a date-time range, the nodes that are affected and the BSMs that are affected. When an outage occurs, check if the outage falls within a planned outage window. If yes, do not consider that outage in the availability calculations.
By clicking on link “Plan Outage” which is available under the menu, application will open “Planned Outage Details “screen. By clicking on + icon you can add Plan outage for the required service.
Contact Person
In an operations center which is using a tool like Command Center, one of the first pieces of information required when a problem is detected is the contact person designated for that Business Service. The idea of this feature is to ensure that Command Center provides an easy way to enter and display this information.
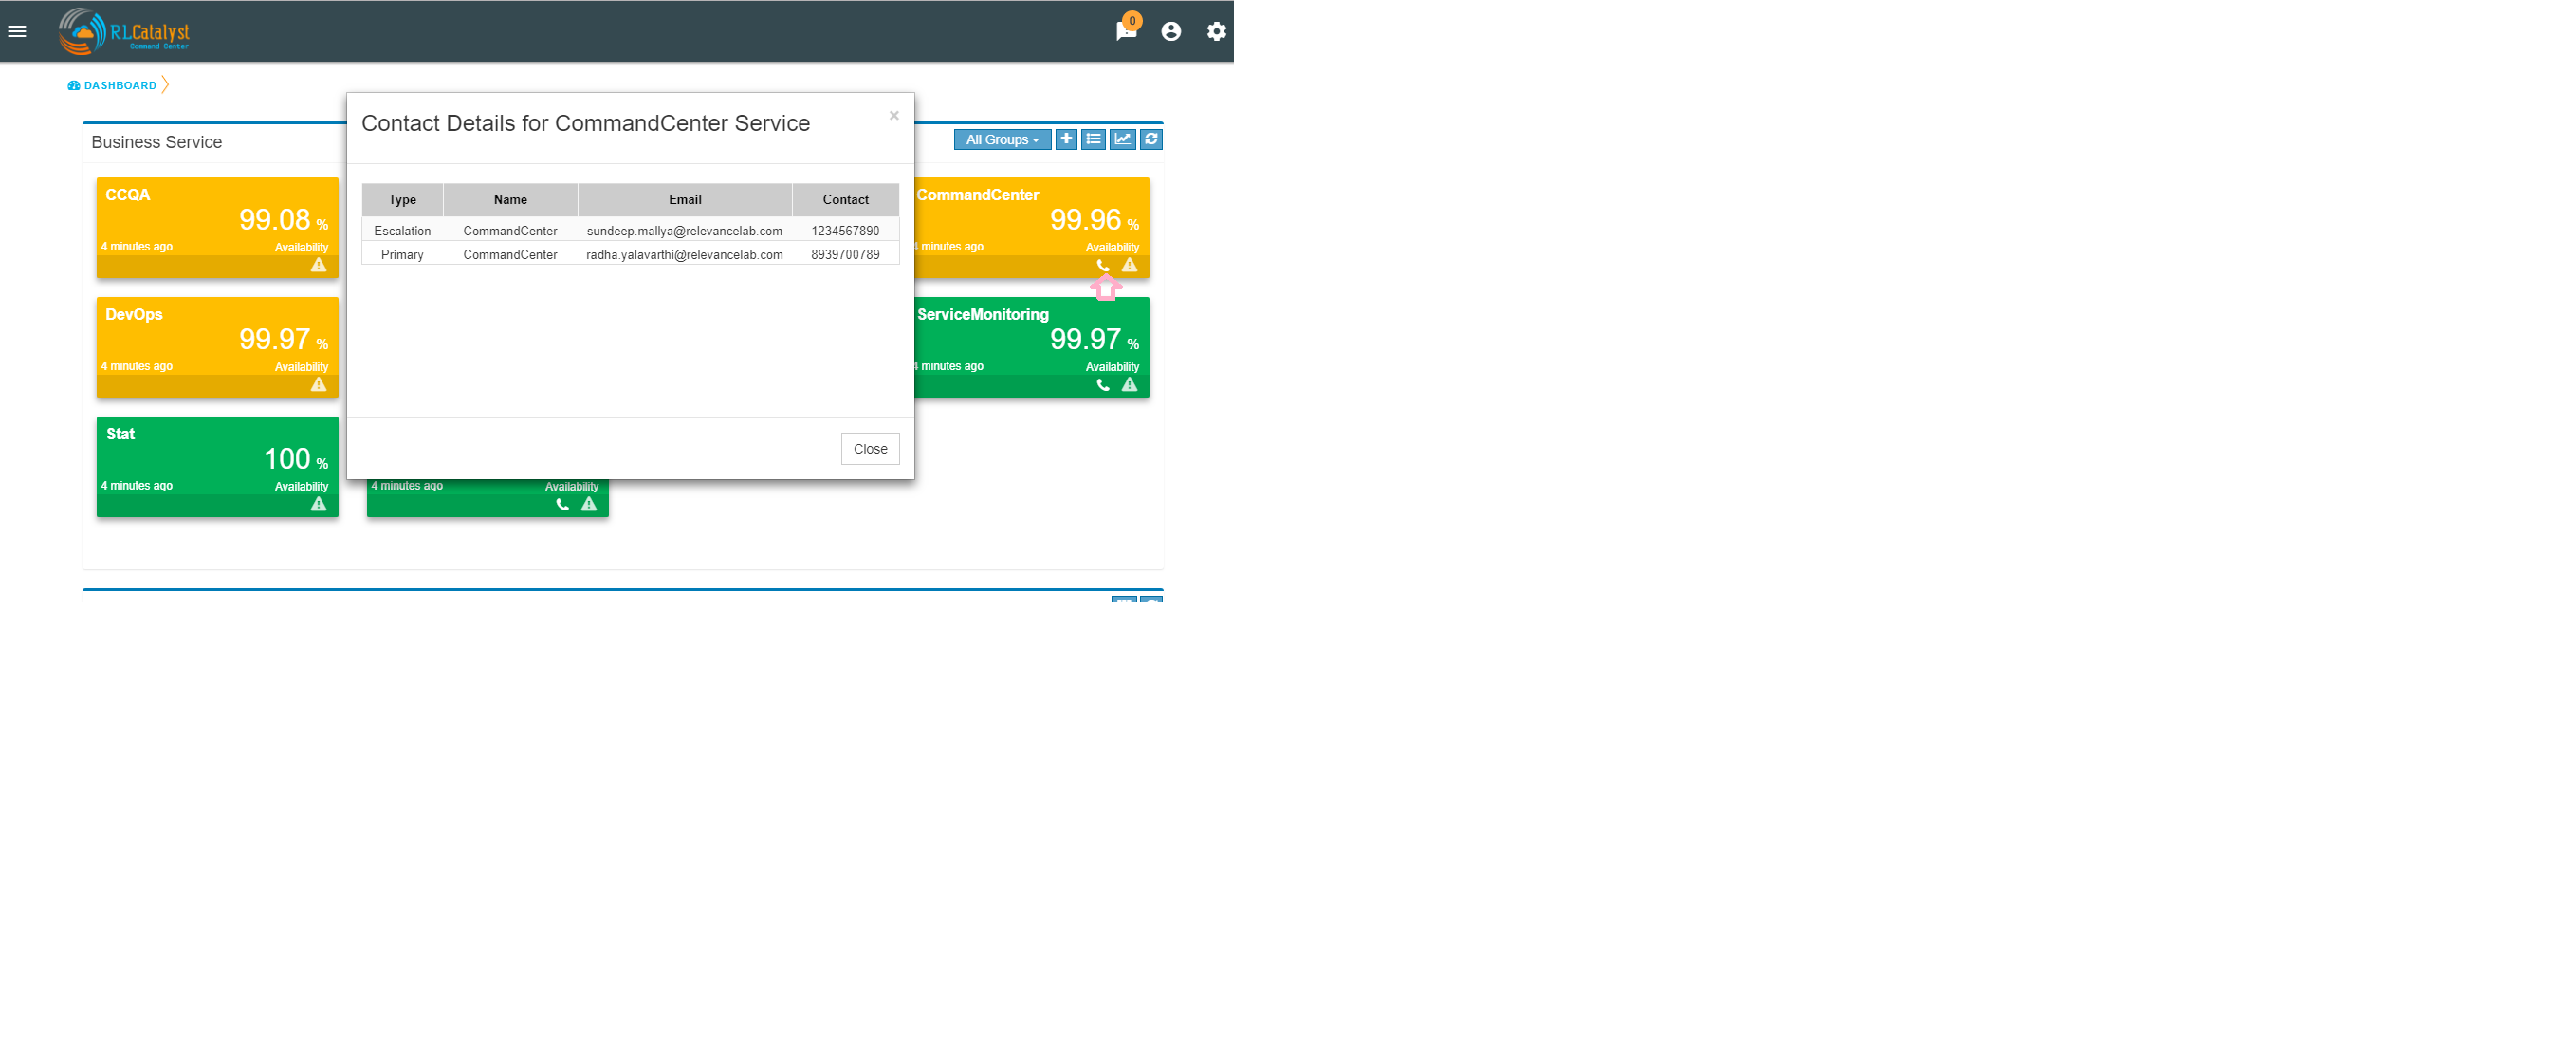
In the Settings screen, provided one more tab called Contact Details.In this screen, we can add Contact Details for each BSM.
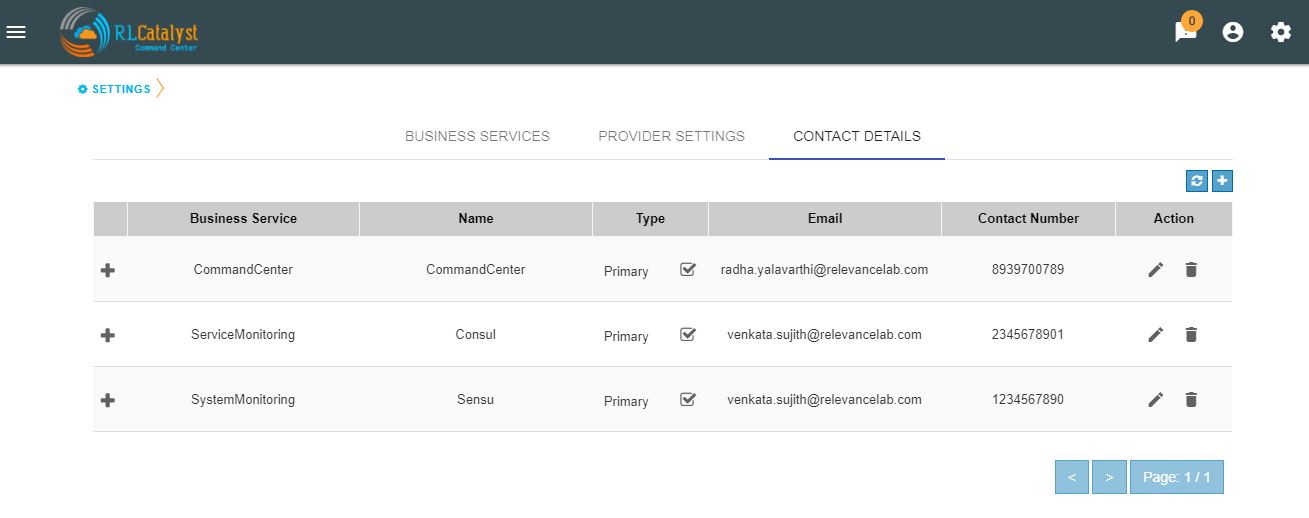
On the Dashboard screen, each BSM card should show a ContactDetails icon. Clicking this icon should present the Contact details for that BSM in a pop-up screen.
Impact Tree
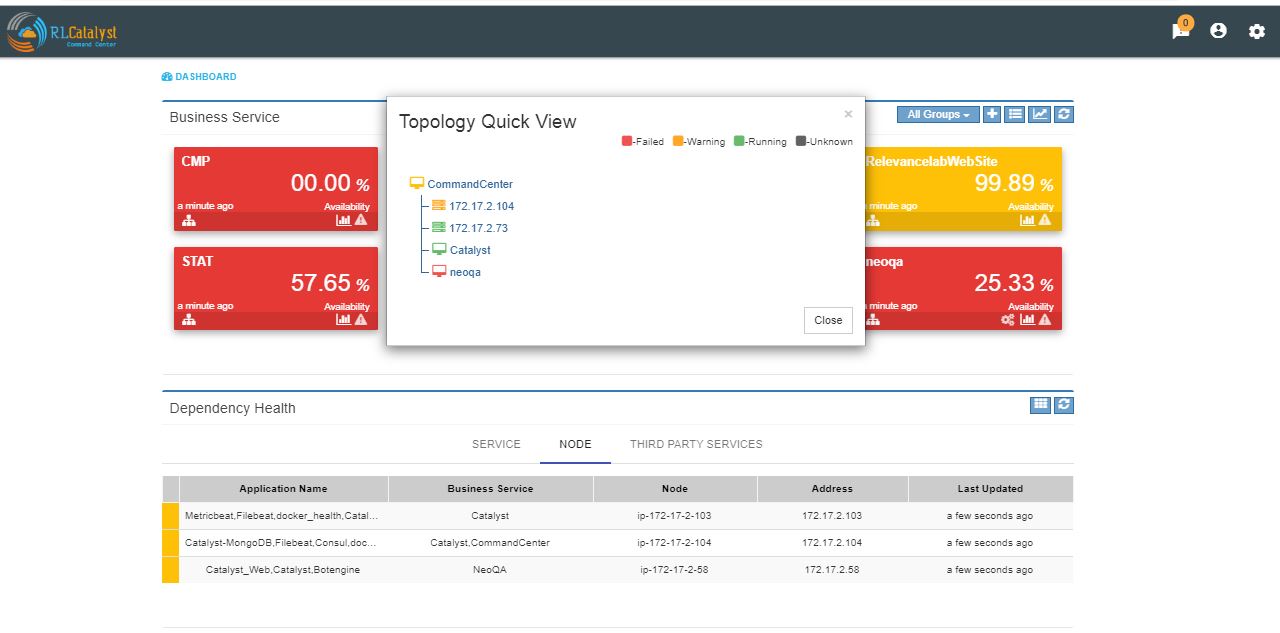
Impact tree provides a quick way to view the quick glance where in the topology the problem is.
On the main Dashboard view, if a BSM card appears yellow, the user should be able to click on an icon that shows at a quick glance pop-up.This pop-up should show a tree-view with the BSM at the top, with the Nodes under it and the services under the nodes.Based on the alerts each level will be marked with a Yellow or Red highlight.
Outage Summary Report
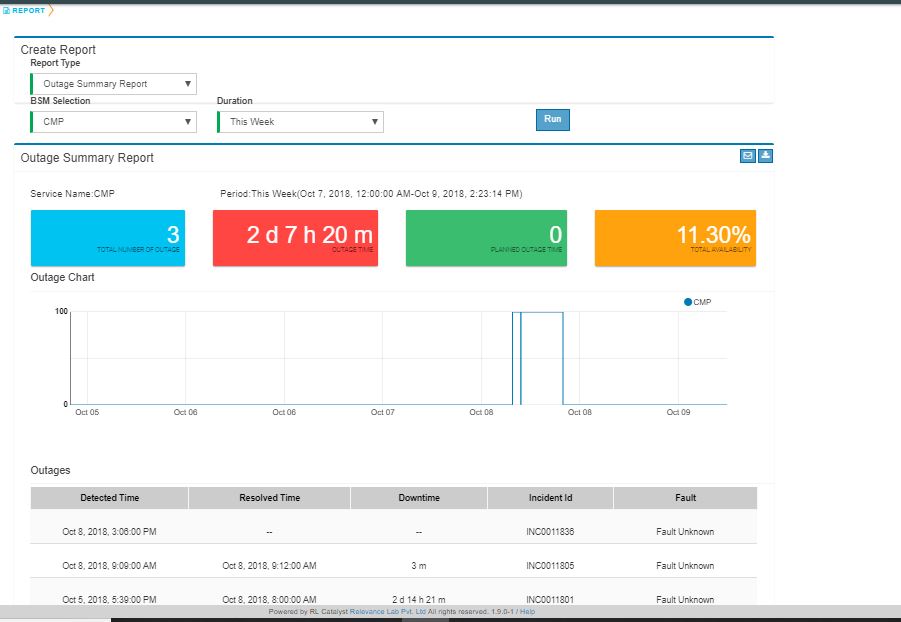
Outage Summary Report will facilitate an operation manager what outages were faced,planned deployments and what early warning was provided by the tool.A report that can be run for different time-periods and which lists the outages and alerts shall be provided.
A new item called “Reports” be added to the application-menu (top-left).
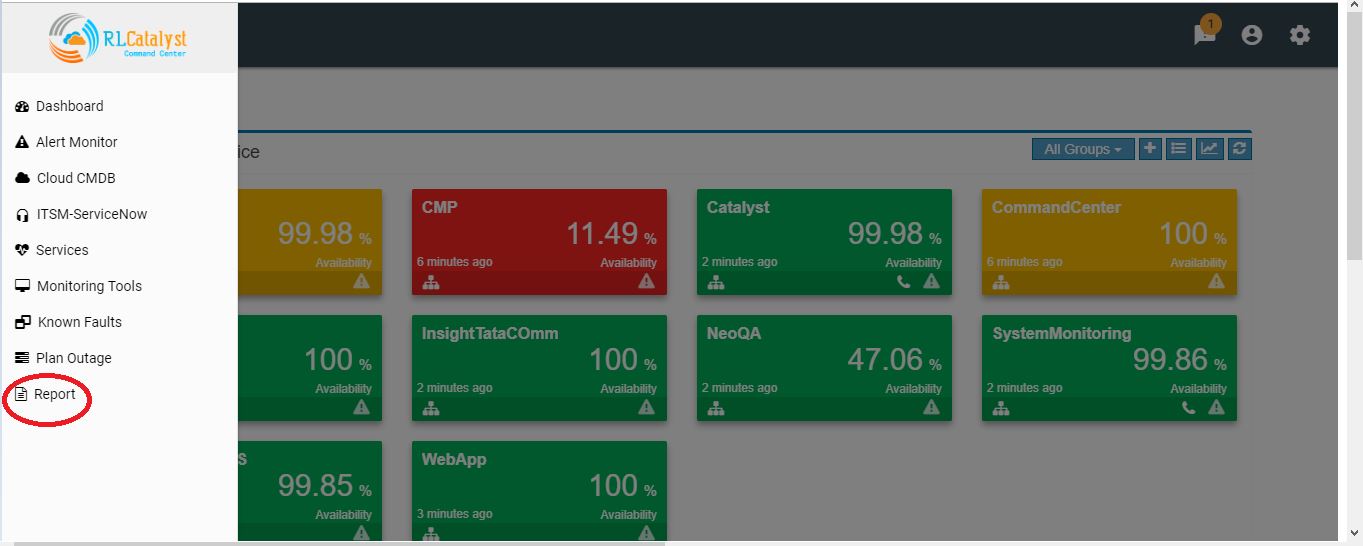
Clicking on the “Reports” menu item shall lead the user to a screen where he can choose the report to run.
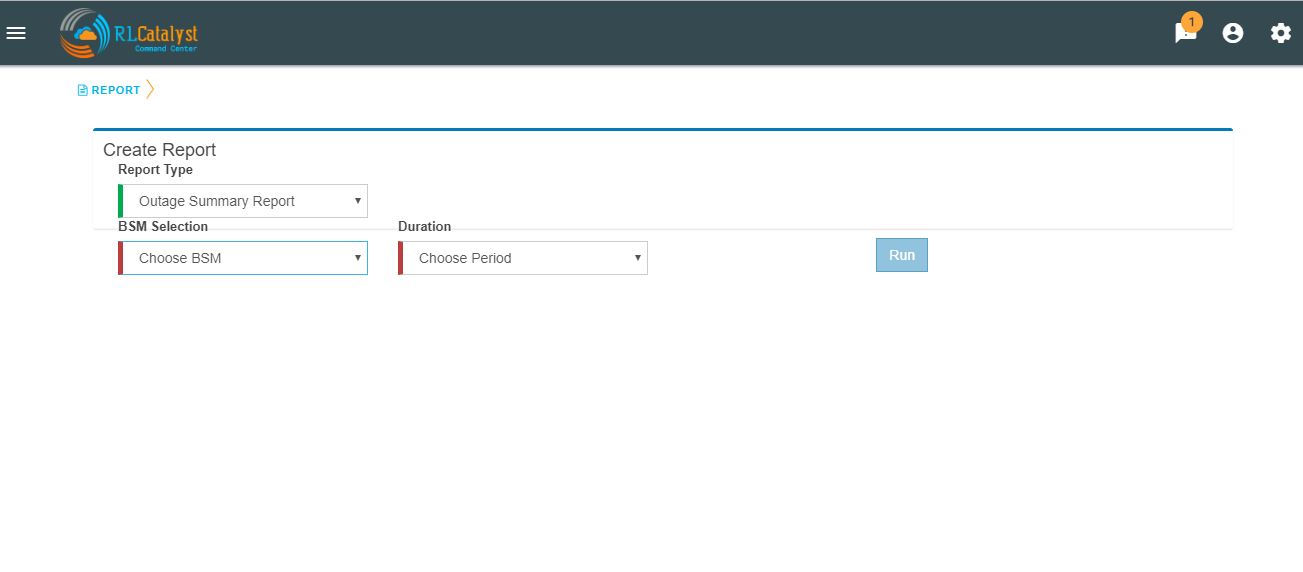
- On choosing the report to run from a drop-down menu, the user shall be displayed the input fields which are specific to that report.On choosing “Outage Summary Report” the following input items shall be displayed.
- BSM: This will be a drop-down that allows a specific BSM item or All BSMs that will run the report under the logged in tenant.
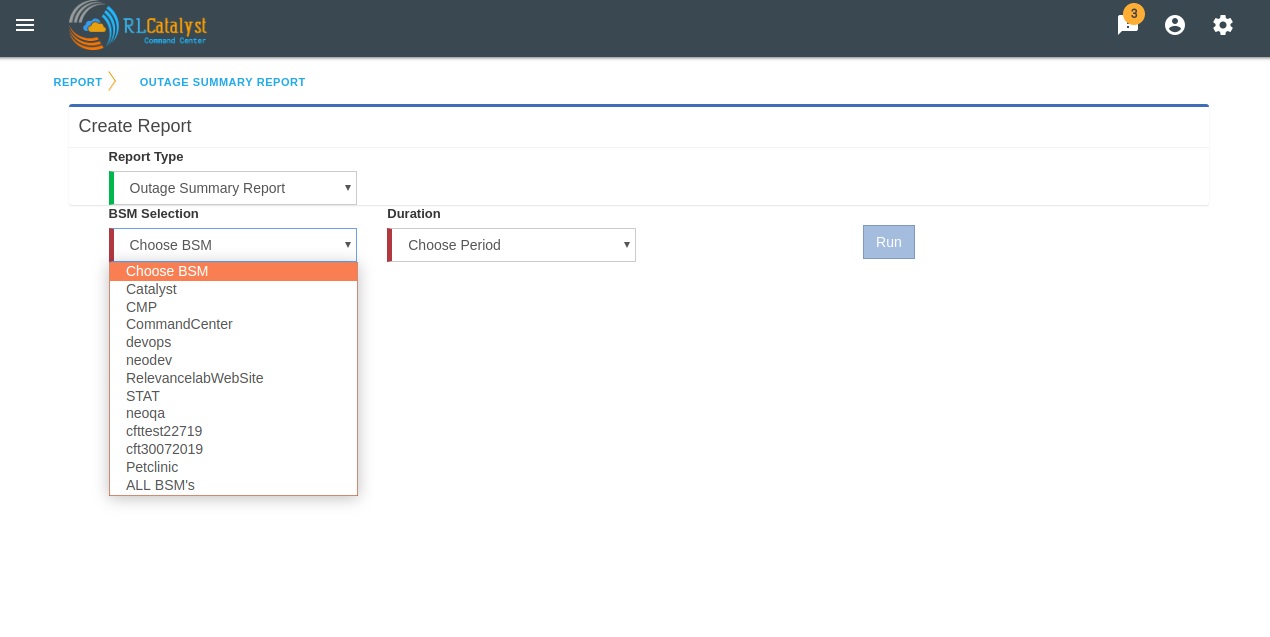
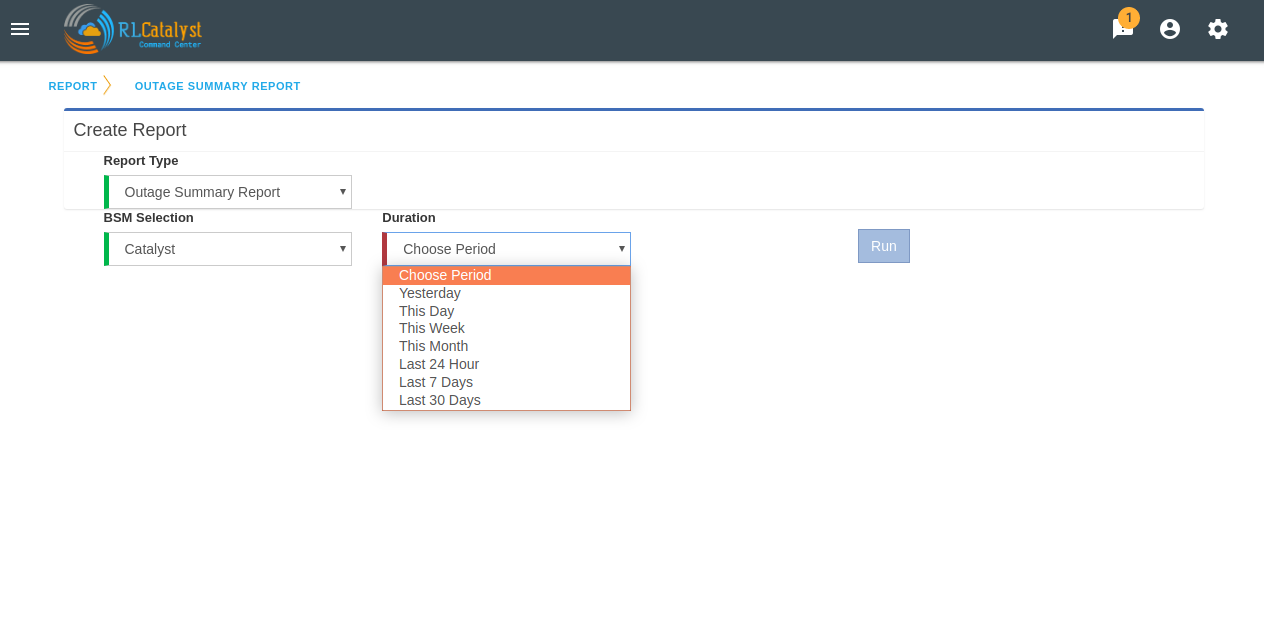
Time-period: This will be a drop-down box that allows the user to choose the time-period. Available choices shall be
Yesterday: Will mean the time-period from yesterday 12:00am to 11:59pm. This day: Will mean the time-period from 12:00am of the current date to now. This week: Will mean the time-priod from 12:00am of Monday of the current week to now This month: Will mean the time-period from 12:00am of 1st of the current month to now Last 24 hours: will mean 24 hour period from current time. Last 7 days: will mean 24*7 hour period from current time. Last 30 days: will mean 30*24 hour period from current time.
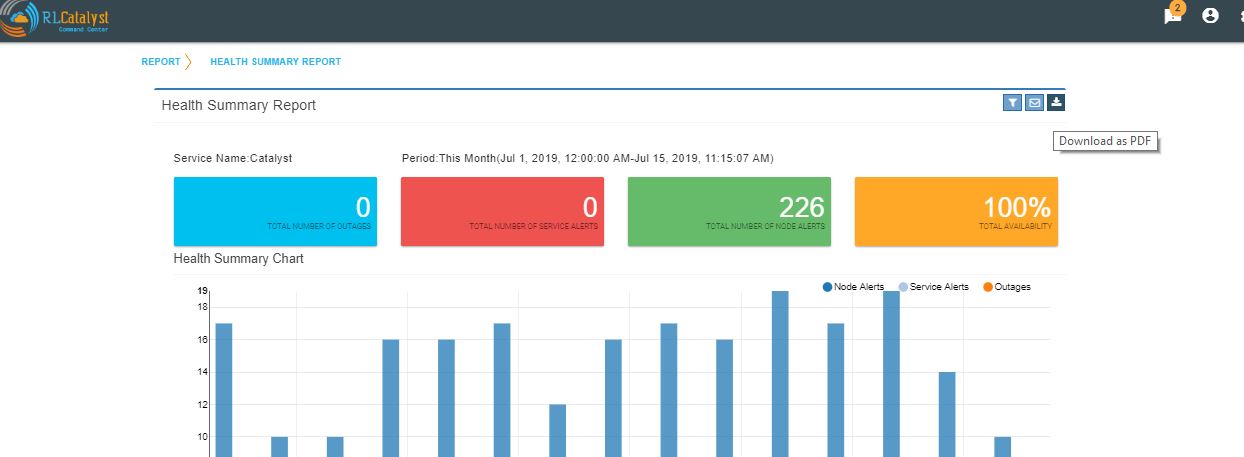
Based on BSM Selection & Duration filter selection,outage summary report shall be generate with the two buttons “Download report as PDF” and “E-mail report”.
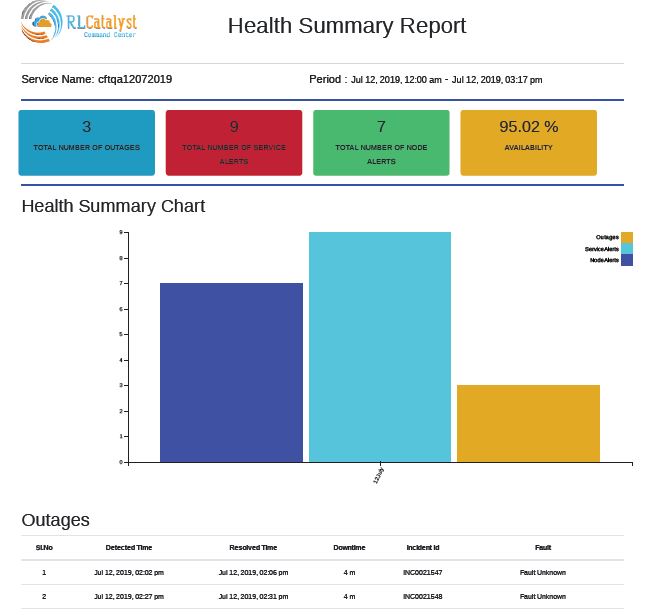
Health Summary Report
Clicking on the “Reports” menu item shall lead the user to a screen where he can choose the report to run.
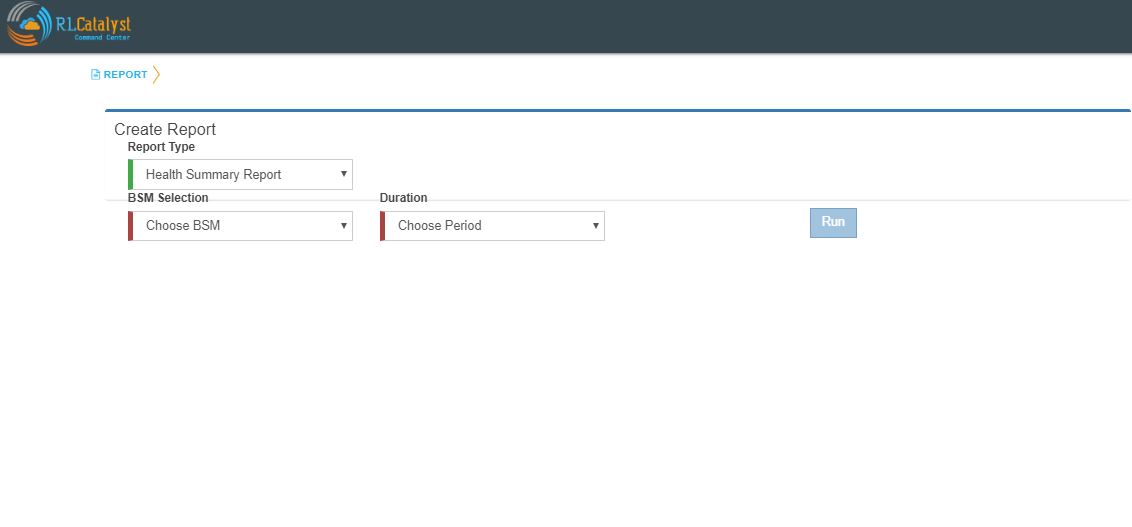
- On choosing the report to run from a drop-down menu, the user shall be displayed the input fields which are specific to that report.On choosing “Health Summary Report” the following input items shall be displayed.
- BSM: This will be a drop-down that allows a specific BSM item or All BSMs that will run the report under the logged in tenant.

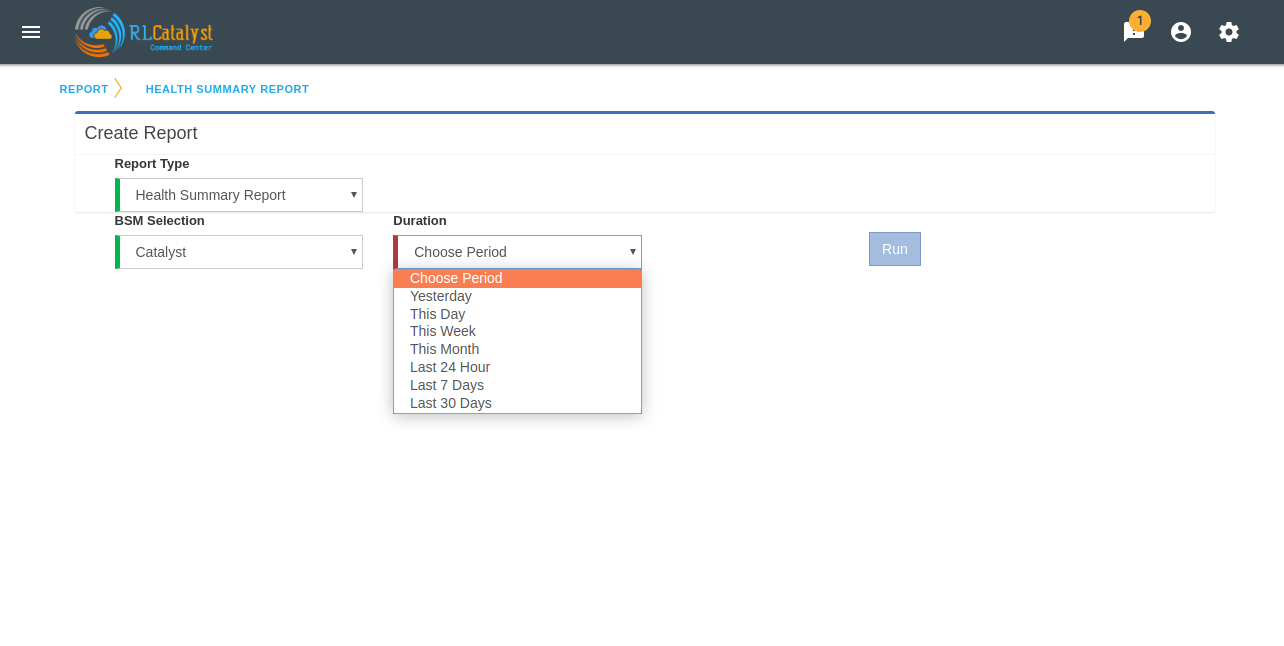
Time-period: This will be a drop-down box that allows the user to choose the time-period. Available choices shall be
Yesterday: Will mean the time-period from yesterday 12:00am to 11:59pm. This day: Will mean the time-period from 12:00am of the current date to now. This week: Will mean the time-priod from 12:00am of Monday of the current week to now This month: Will mean the time-period from 12:00am of 1st of the current month to now Last 24 hours: will mean 24 hour period from current time. Last 7 days: will mean 24*7 hour period from current time. Last 30 days: will mean 30*24 hour period from current time.
Based on BSM Selection & Duration filter selection,outage summary report shall be generate with the two buttons “Download report as PDF” and “E-mail report”.
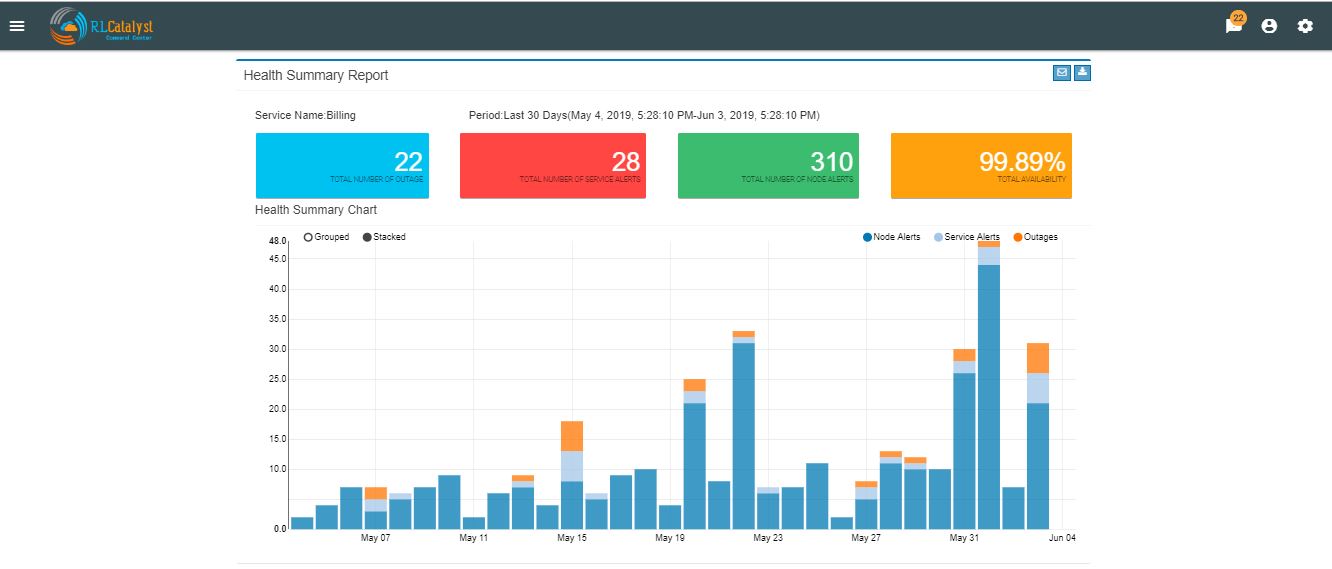
Command Center reports available in PDF format
Command center is providing reports in PDF format with graph and data for both Health summary report and Outage summary report. user can download or send as email the pdf report format. report will be available in all the filters.
Downloaded report will be same as bellow for Health summary report.
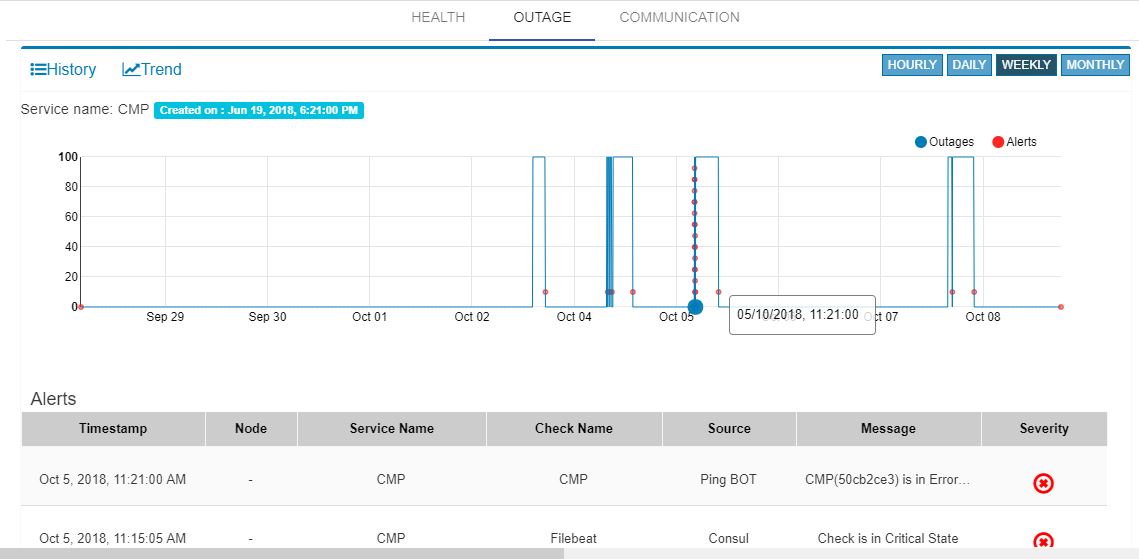
Pre-outage Window Analysis
In case of an outage, an operations manager would like to quickly check what alerts have been raised in the time immediately preceding the outage. Pre-outage window analysis feature is to make this information readily available.
In the Outage page under trend-view, shall display the alerts raised against that service or its linked nodes & services on the trend chart as red (error) dots. When the user clicks on a specific outage, screen shall show the alerts in the bottom panel.
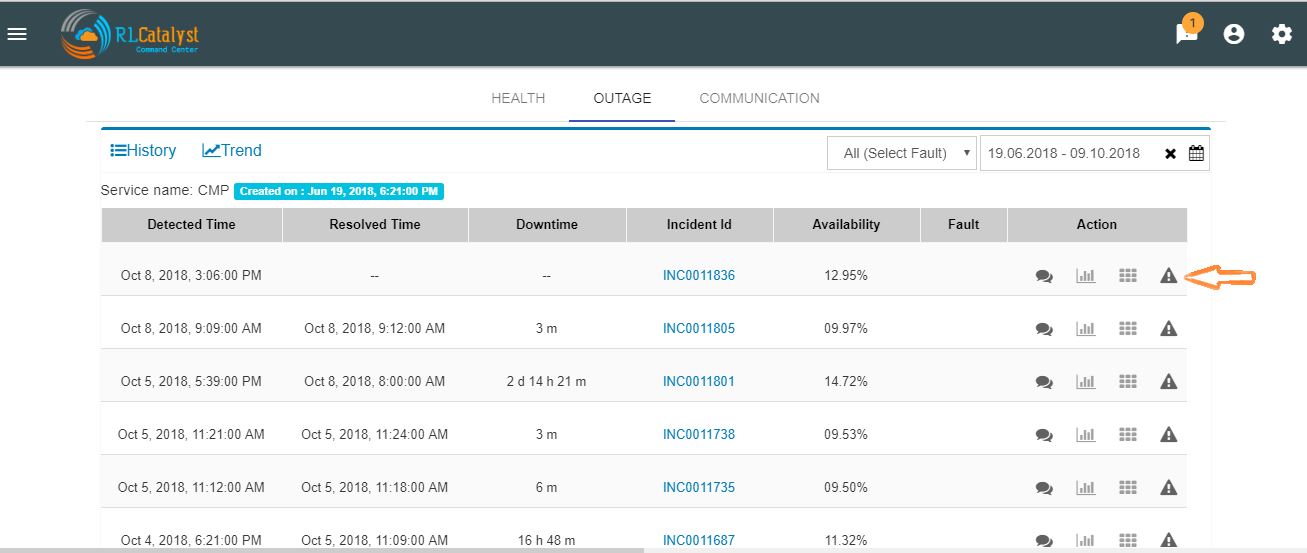
In the Outage page under History-view, an Alerts icon shall be displayed to the user under the “Action” column. Clicking on the icon should lead the user to the Alerts Monitor page with the alerts for only that BSM listed with the latest alert being the last alert seen preceding the Outage detection time.
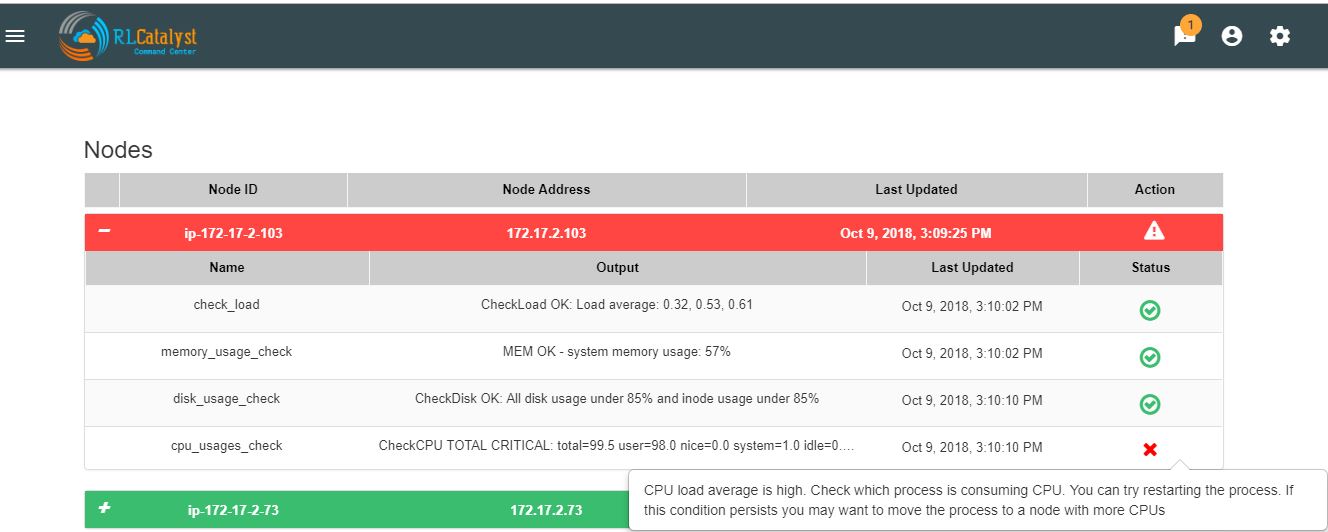
Information pop-up when checks fail
Command Center will show the user warnings or errors for system parameters when certain thresholds are crossed for certain metrics (CPU, disk usage, memory usage). The idea of this feature is to provide the user with helpful information against these warnings.
The user shall be shown an “info” icon against each warning or error for the system checks (CPU, disk usage, memory usage)in the BSM drilldown screen. This icon will be shown under the “Action” column.Clicking on the icon will show the appropriate message to the user.
Runbook Automation
Operations teams define runbooks so that all team-members have access to precise information regarding routines and procedures that are carried out. These runbooks contain information about the specific systems that are being monitored like server IPs, dependent services and the topology. Runbooks also document the Standard Operating Procedures that are to be followed for specific situations. Runbooks are important repositories of knowledge when team-members are trying to resolve outages or trouble-shooting problems. They also provide a reliable documentation that can be followed to achieve specific outcomes.
RLCatalyst now allows users to automate these runbooks as collections of BOTs and execute specific runbooks against Business Services and the underlying infrastructure or components.
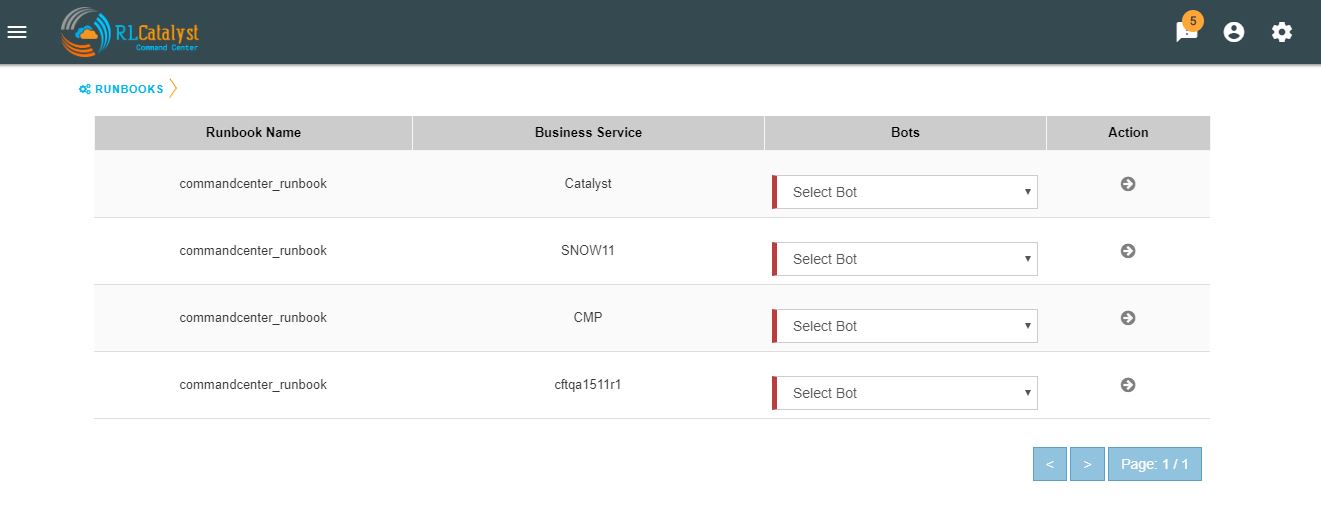
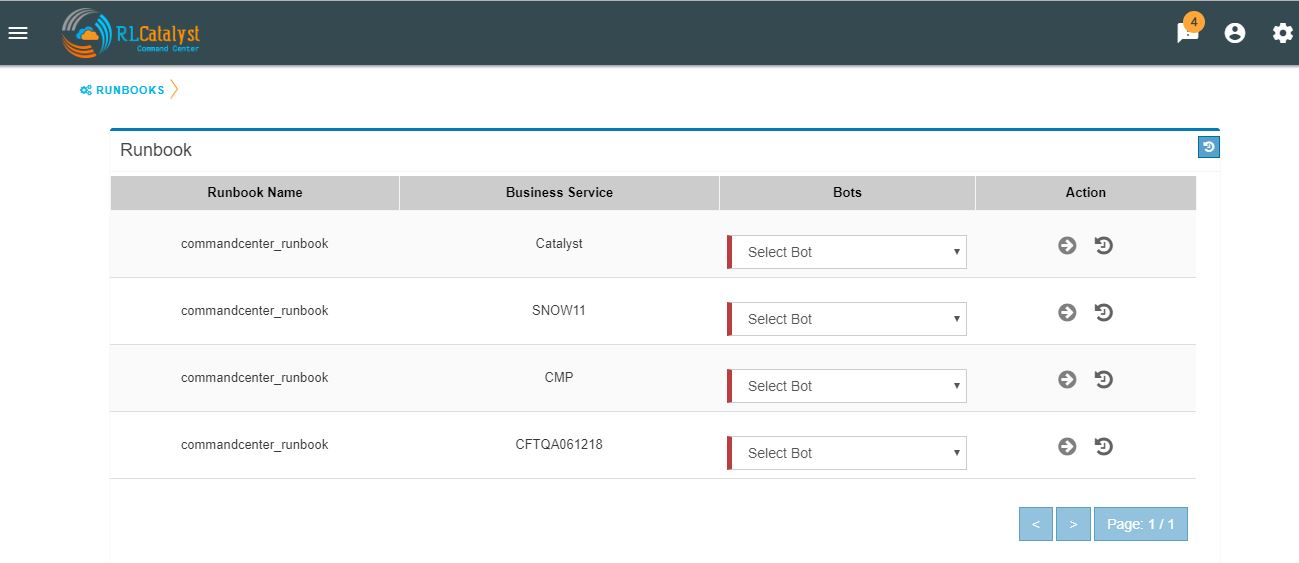
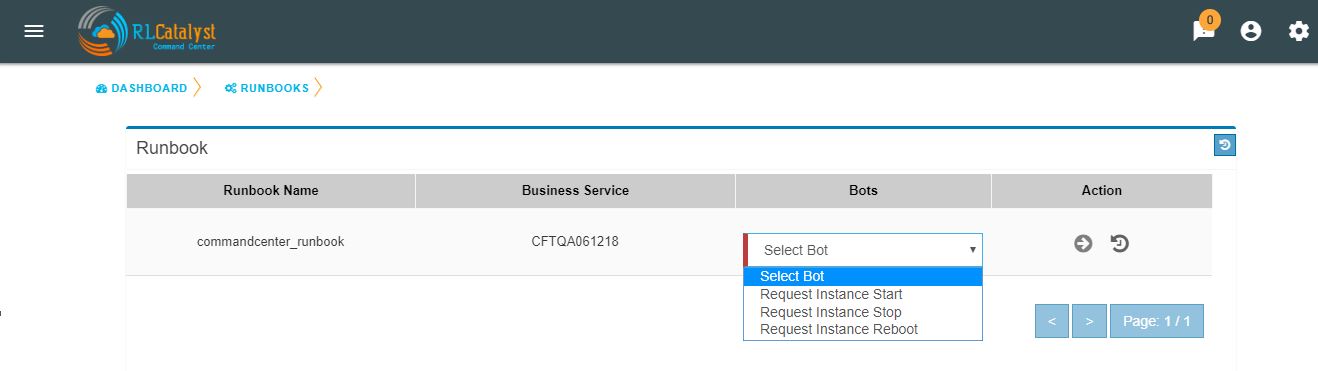
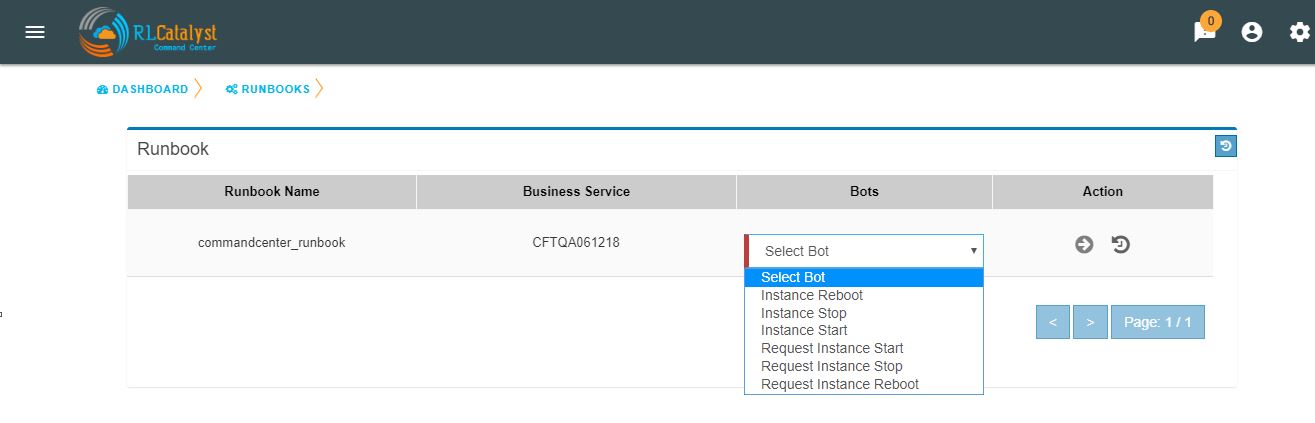
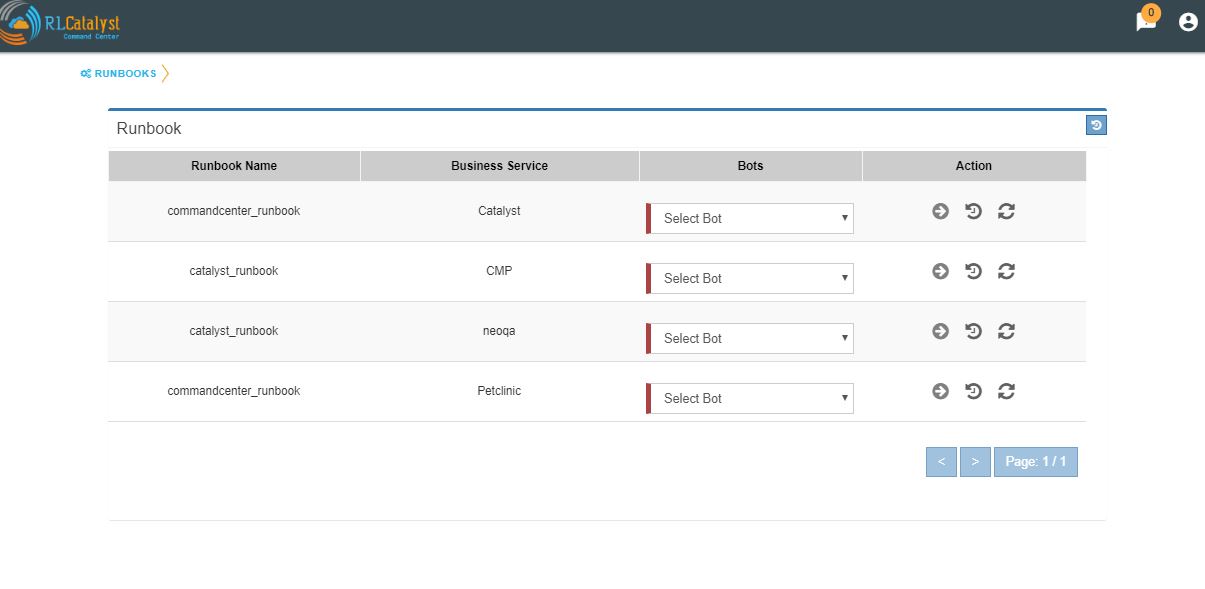
A new item called “Runbooks” link is added to the application-menu (top-left).
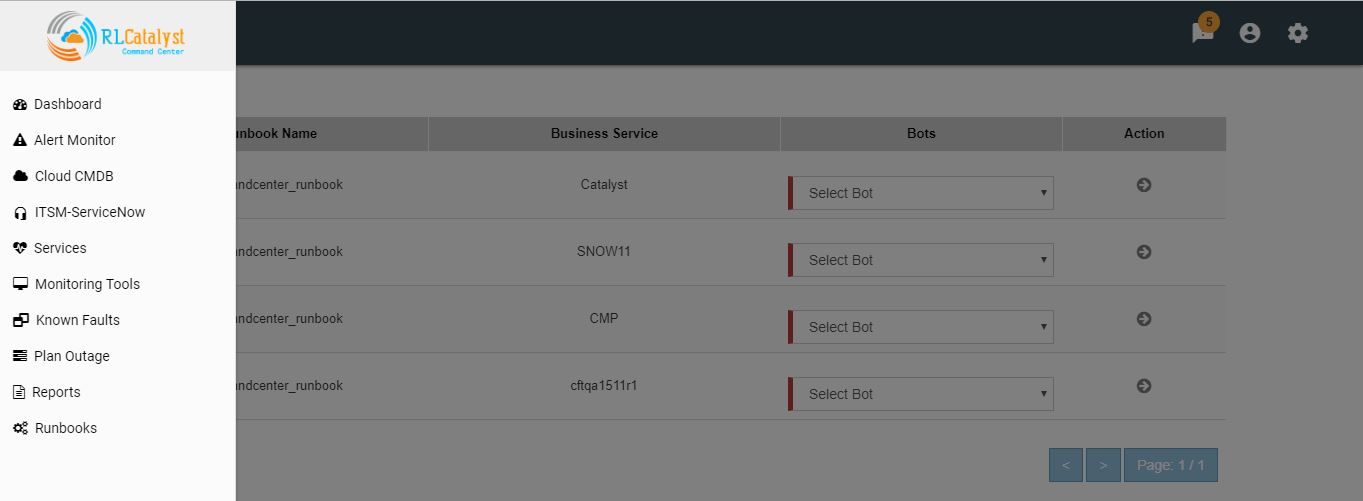
Clicking on “Runbooks” link will navigate to the Runbooks screen.
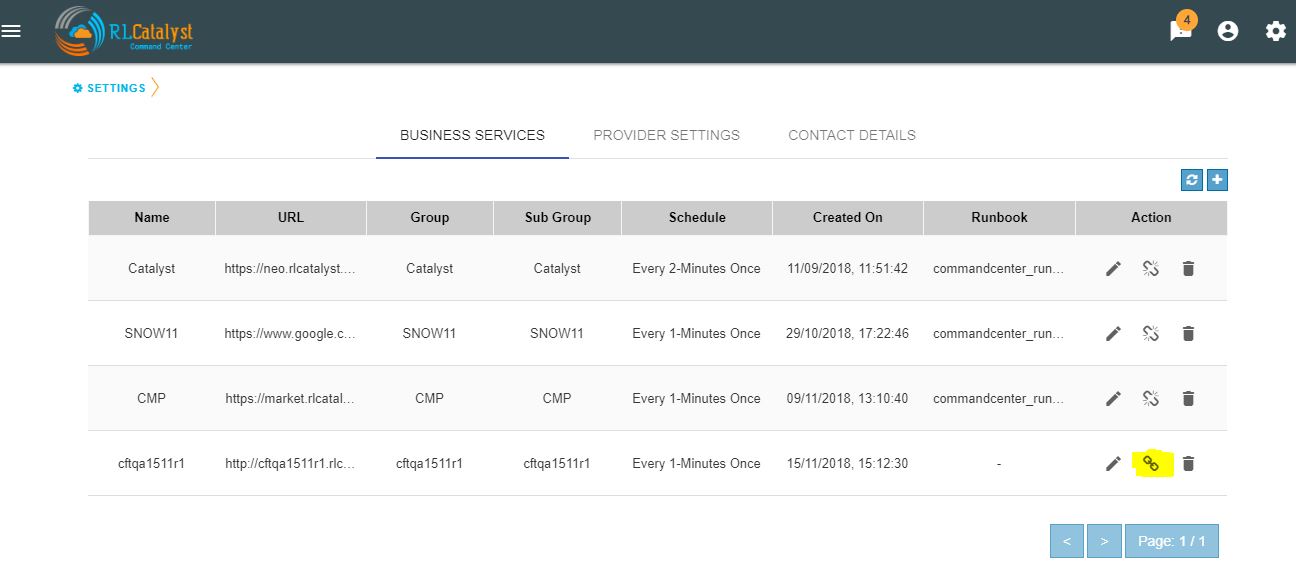
You can opt for Runbook Automation option by associating the runbook to the BSM by clicking on the “Link Runbook” button which is available under Business Services tab in the Settings screen.
On the Dashboard screen, BSM card should show a Runbook icon when a Runbook has been linked with the Business Service.
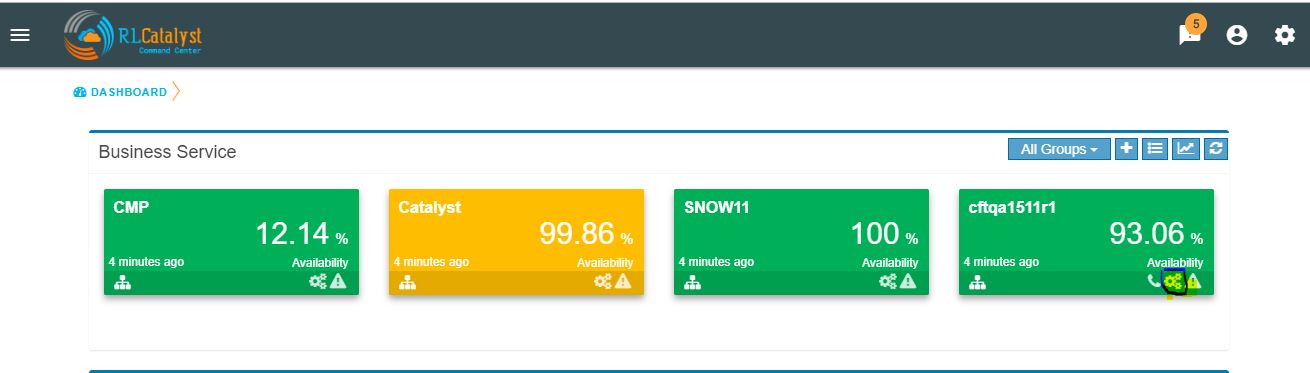
Clicking on Runbook icon in the DashBoard screen, should navigate to the Runbooks screen of that Business Service
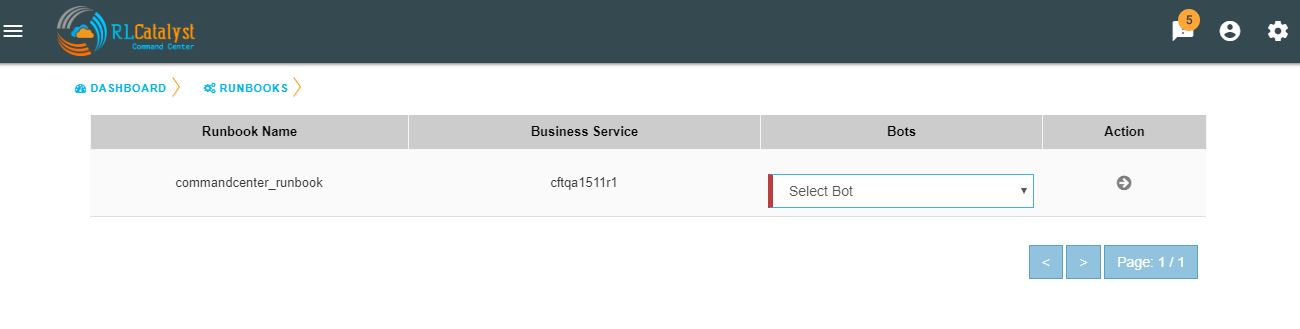
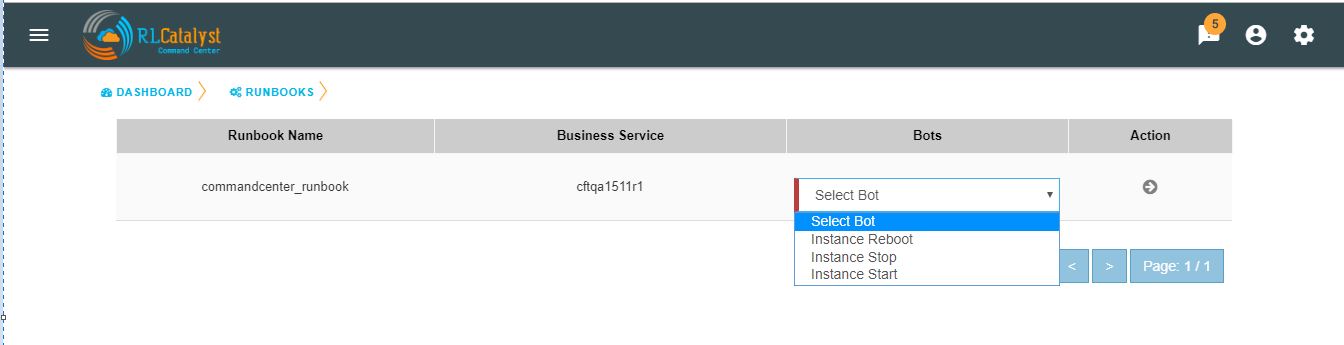
You can choose the required BOT from the BOT’s selection menu in the Runbooks screen and click on Next Step button.
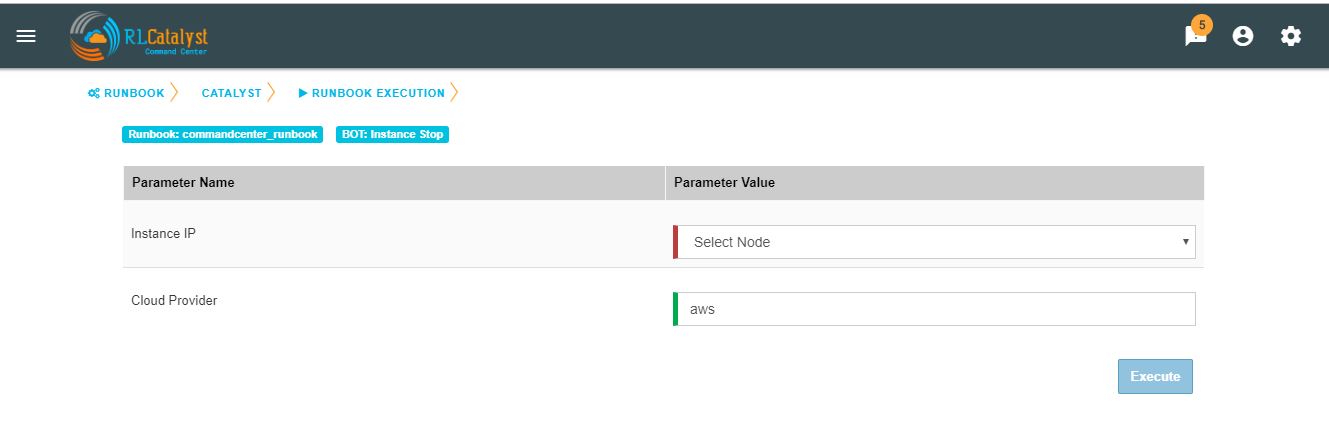
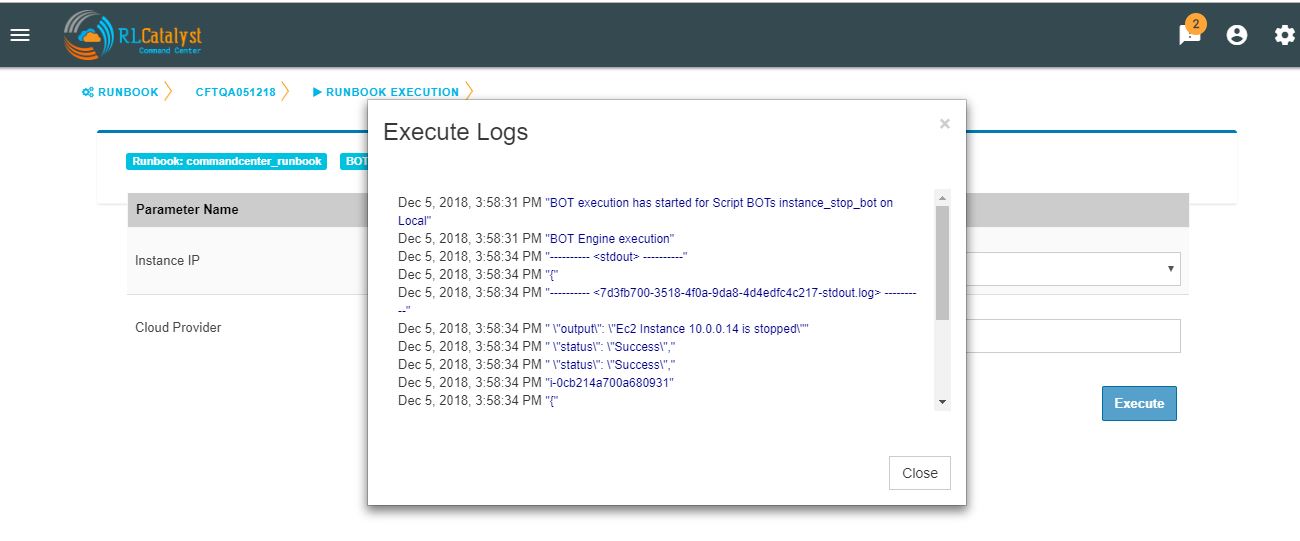
You can execute BOT by passing required parameters to the IP, Cloud Provider and click on Execute Button.
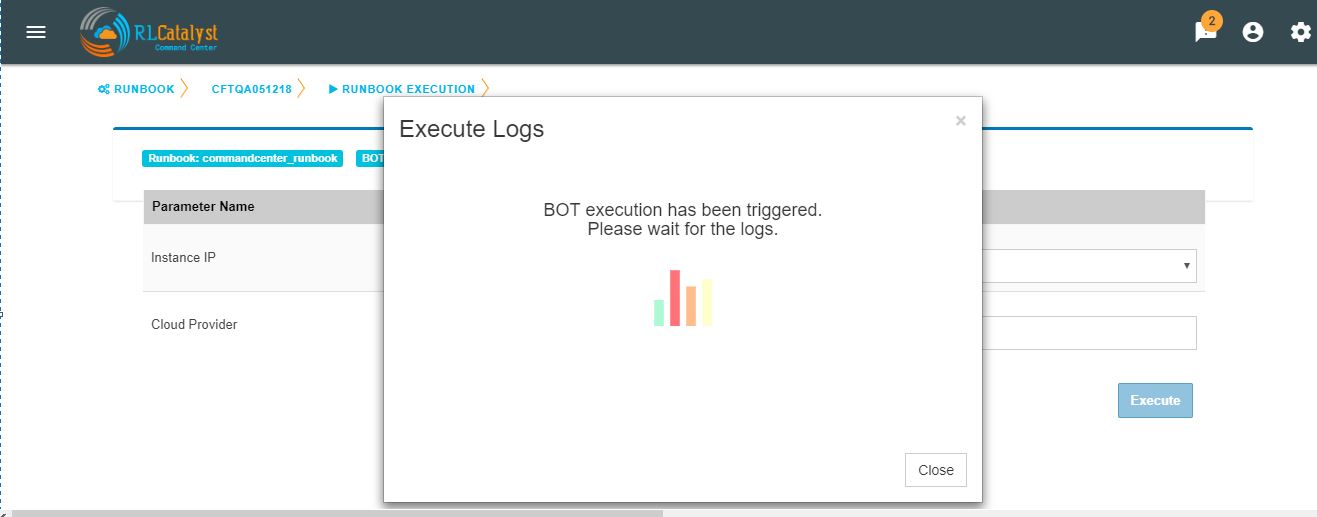
On BOT execution ,user can see a popup message about the BOT execution after that logs of that particular BOT execution as a popup.
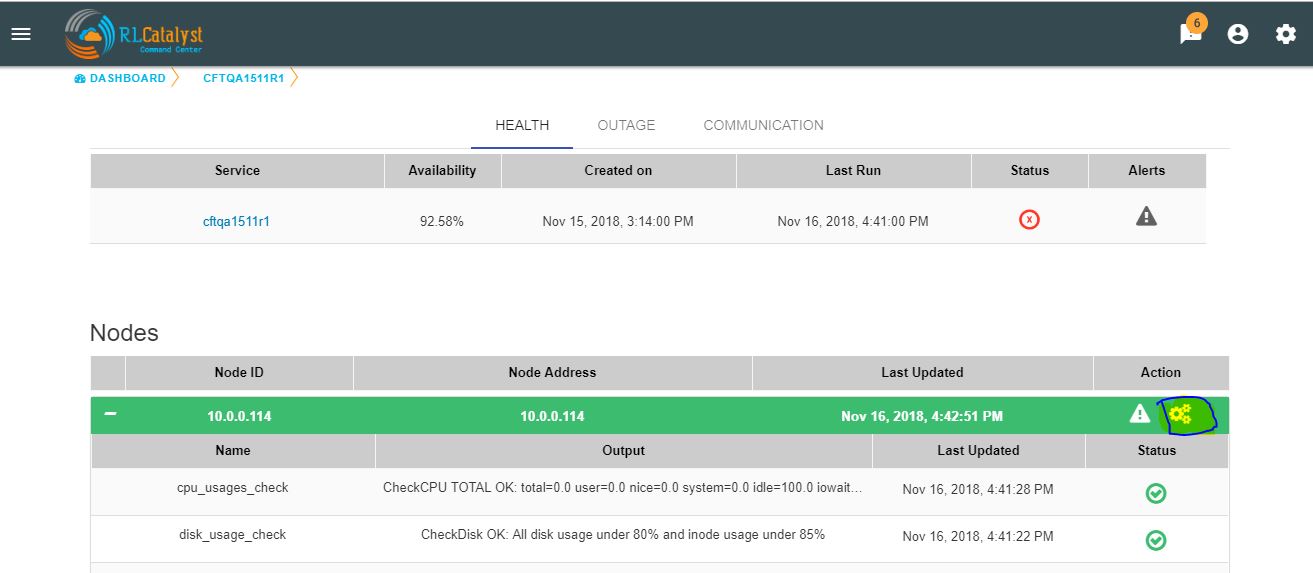
You can execute BOT from the BSM Drilldown screen by clicking on the “Run BOTS” icon available against nodes.
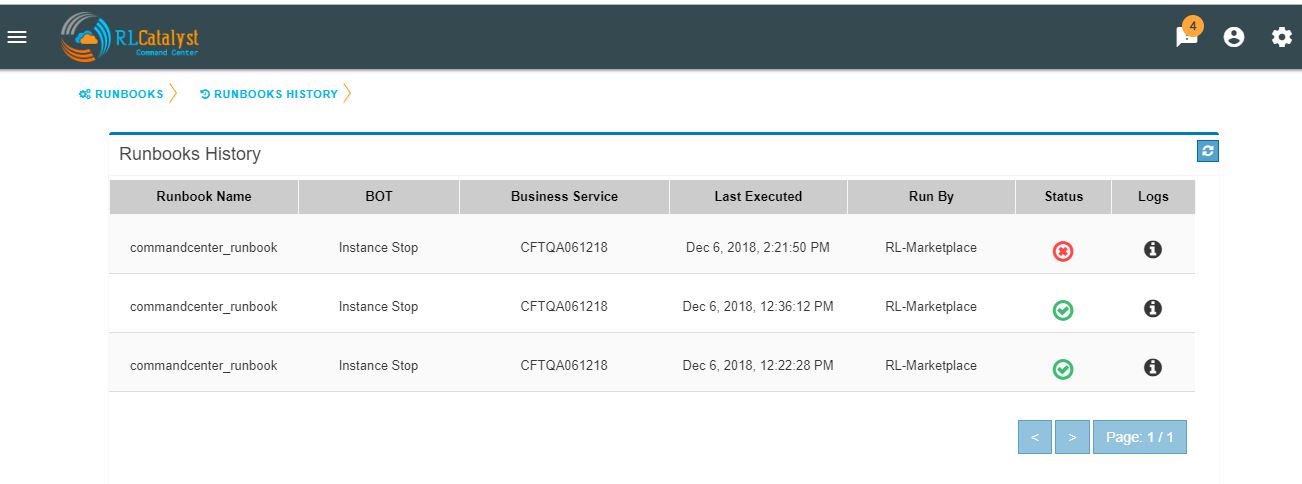
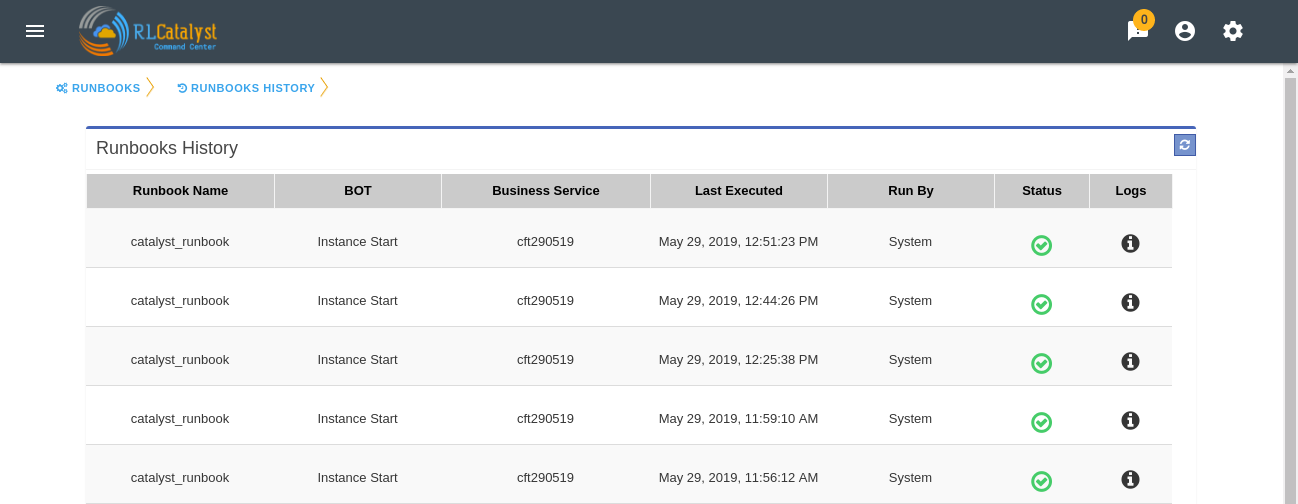
Runbook History
Runbook History will record Success and Failure streams intended to log problems that occur in a runbook. They are written to the Runbook history when a runbook is executed.
A new item called “Runbooks History” will show as an icon in the Runbook screen and it will display the available runbooks history
Clicking on “Runbooks History” icon in the Runbook screen will navigate to “Runbooks History” screen.
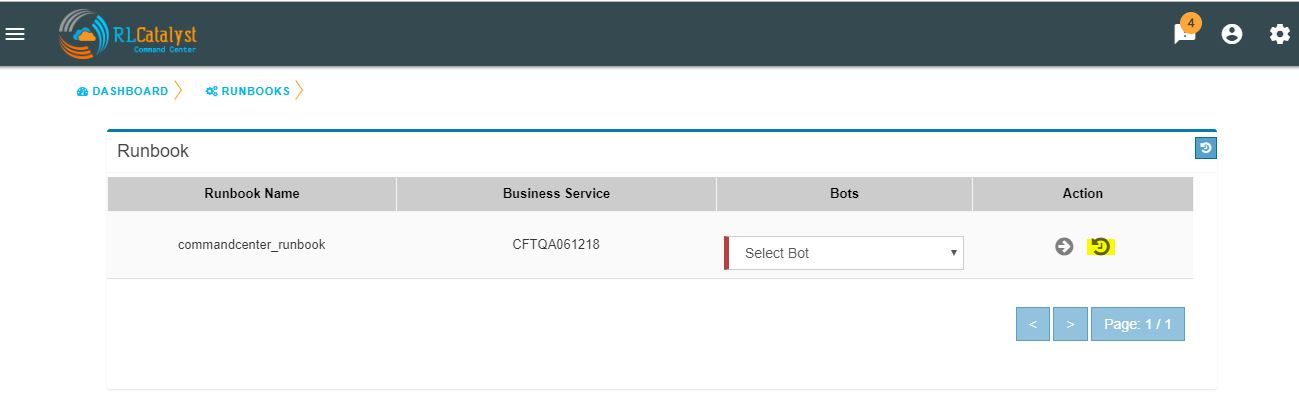
You can view the particular Runbook history by clicking on the “History” icon which is available in the specific Business Service related Runbook screen.
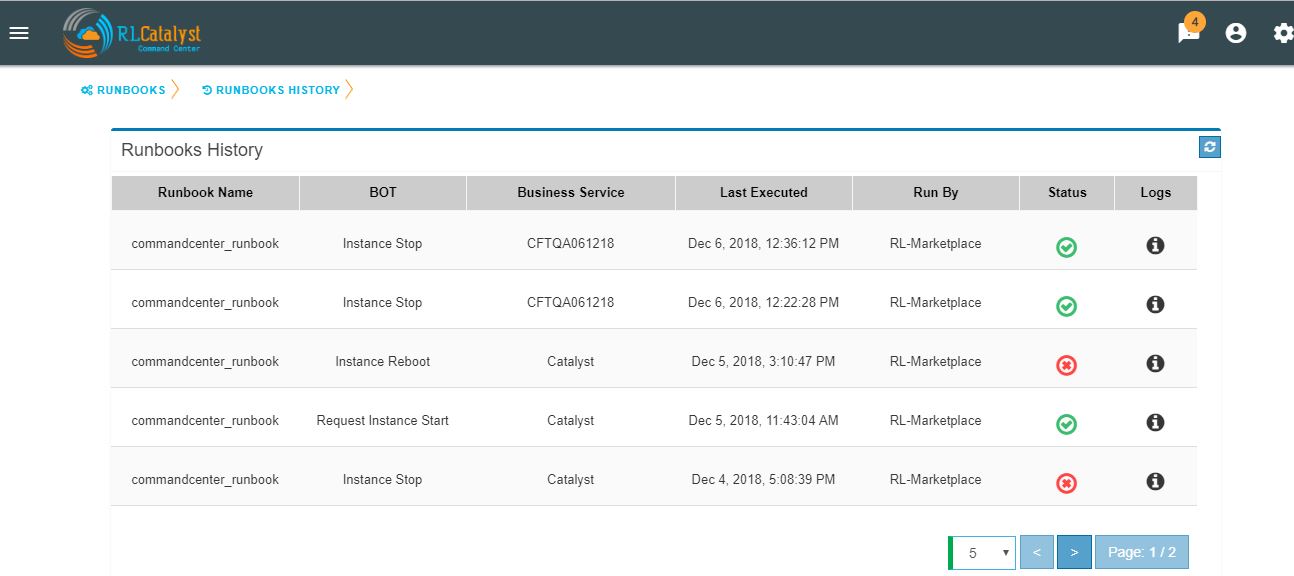
By clicking on “History” screen you can view the specific Business Service related runbook history.
Role based access to BOT’s
CommandCenter facilitates the role-based access permissions to the BOT’s. Based on the level defined for the logged-in user, the system will display the BOTs to the user which he is entitled to run. Level 0, Level 1 are the two levels defined in the CommandCenter. You can extend the levels based on need.
BOTs availability for L0 user :
BOTs availability for L1 user :
Event triggered runbook execution
Event triggered runbook execution feature will run the BOT when event is triggered. User can add their own event by editing BOTs factory file. Once the alerts got triggered from sensu/consul/pingbot the respected BOT will run. User can add notifications bot like(SMS_BOT/Email/slack). Once the BOT is triggered user can verify this from CC(Runbook -> Bots history.)
BOT Context
This list consist of the BOT parameters that CC can accept currently to execute Event triggered BOTs. When a BOT is written, it can have parameters only from below list. If some other parameter is passed, BOT will be executed with default parameter given with BOT’s definition.
| BOT Parameter Name | Description | |
|---|---|---|
| Account Name | Enter a Friendly name | |
| awsInstanceIp | IP of AWS instance on which operation is to be performed by BOT | |
| sourceCloud | Credential name by which credential is saved Catalyst. | |
| sender_name | Name of sender by which SMS to be sent. | |
| message | Body of Message. | |
| apiKey | API key required to send SMS to user. | |
| number | Receivers phone number. | |
Event triggered BOT
Event triggered runbook execution feature will run the BOT when event is triggered.
User can configure which BOT can execute on which event by editing runbook. Once the event got triggered from server the configured BOT will run.
| Event trigger Parameter Name | Description | |
|---|---|---|
| checkID | Check ID in server | |
| severity | severity of check in server | |
| source | Server name | |
| state | Check state | |
| botID | BOT ID from catalyst. | |
Once the BOT and Event are created need to sync the Botfactory in Catalyst and then CC.
Refresh Runbook in CC
User can update the cache in CC using “Refresh Runbook” icon.
Refresh Icon in CC:
History of runbook contains the RunBy column as user can verify the BOTs triggerd information based on tenant or automation BOT.
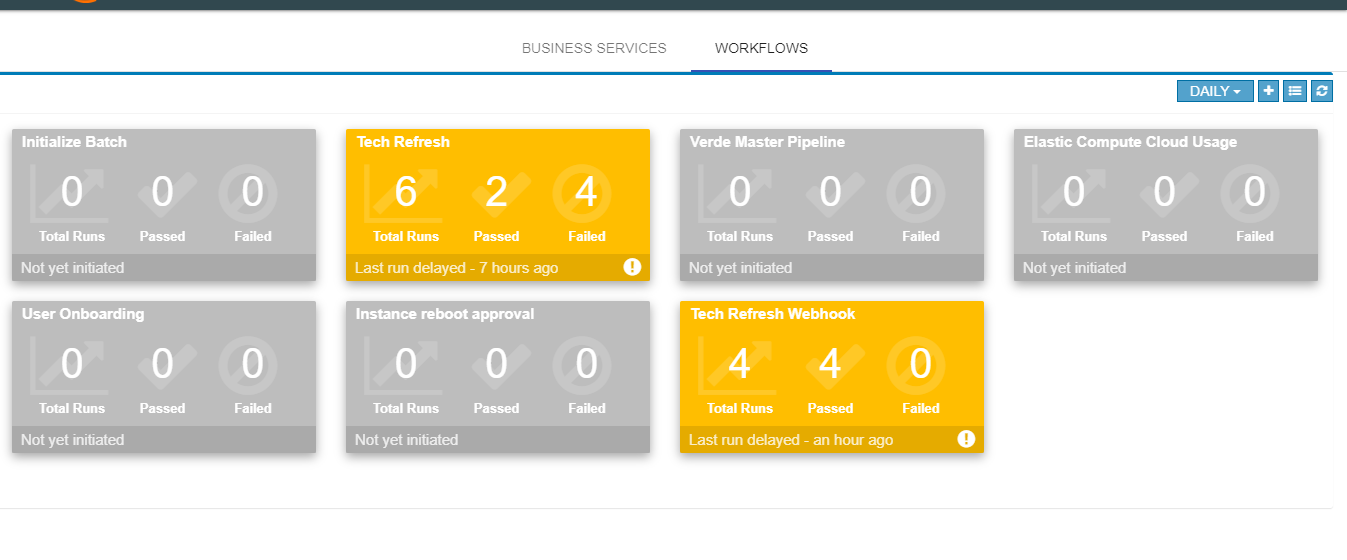
Workflow Monitoring
Workflow monitoring feature is used to monitor the workflows, which are run under the RLCatalyst Workflow Engine. The individual nodes in the workflow are modelled as BOTs.
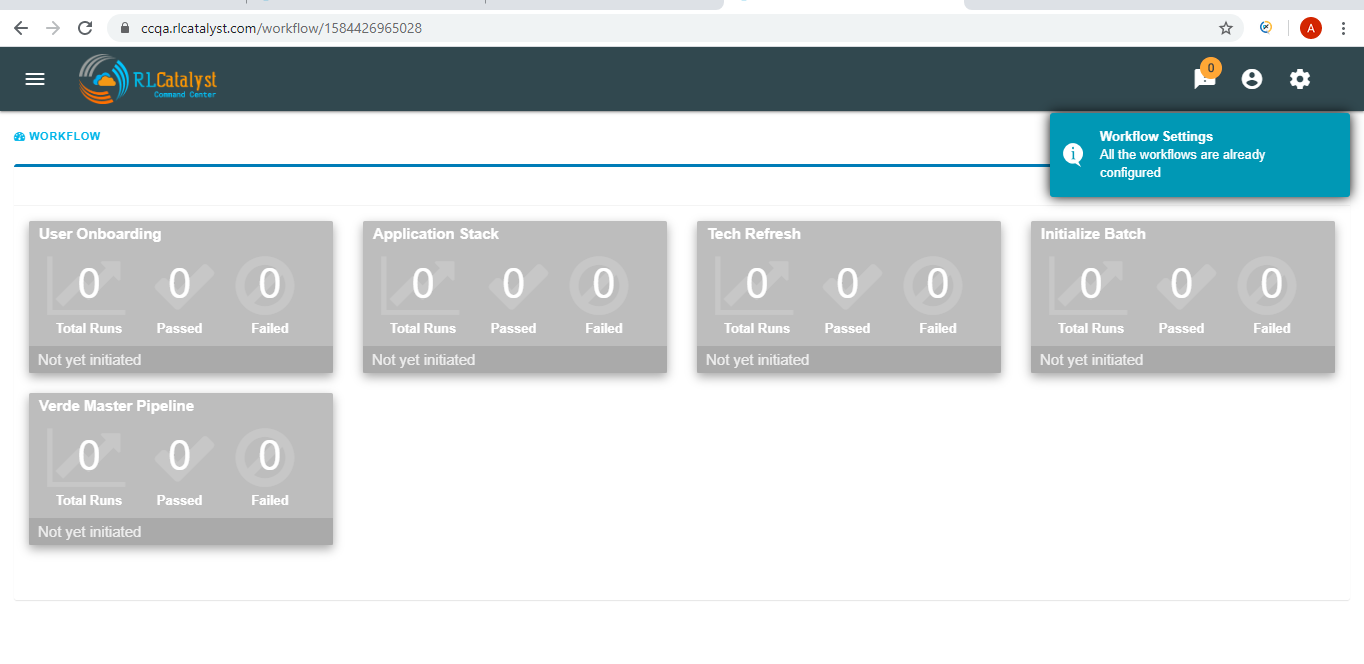
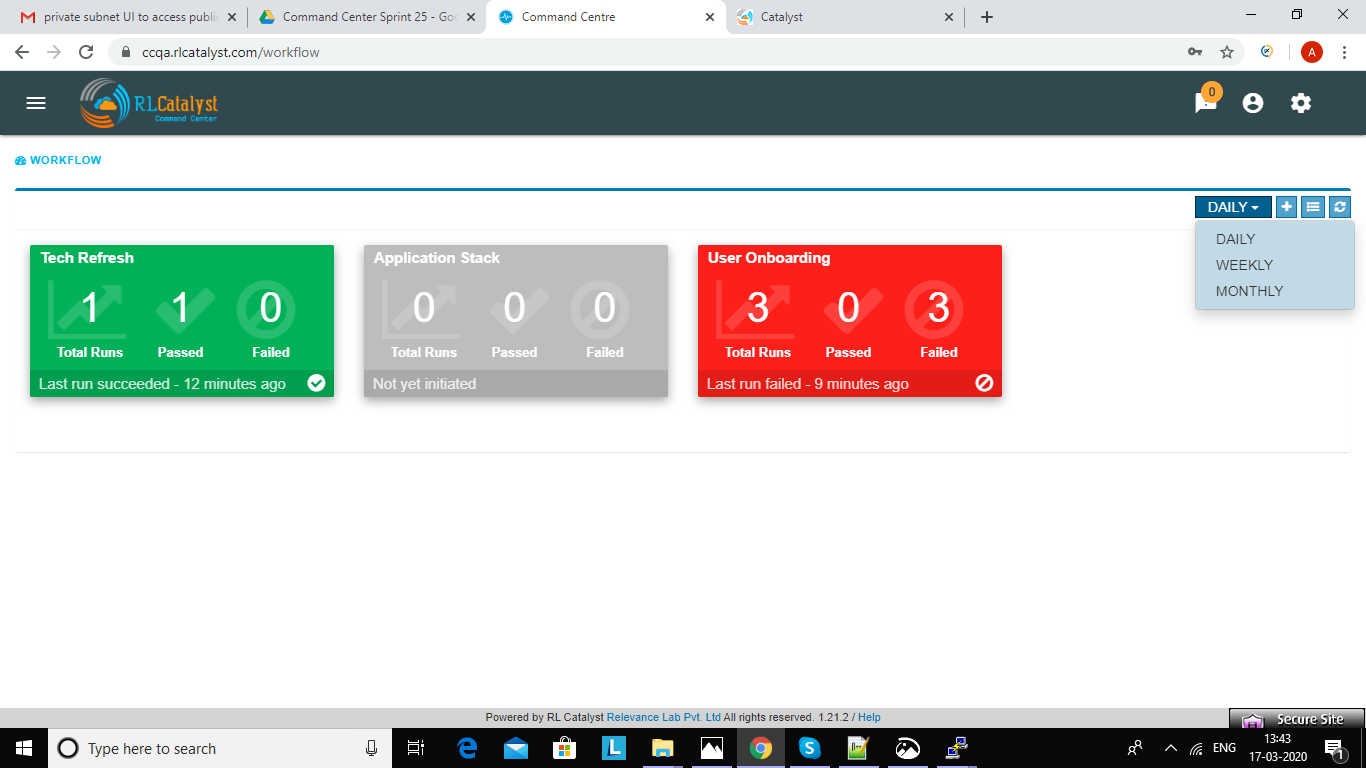
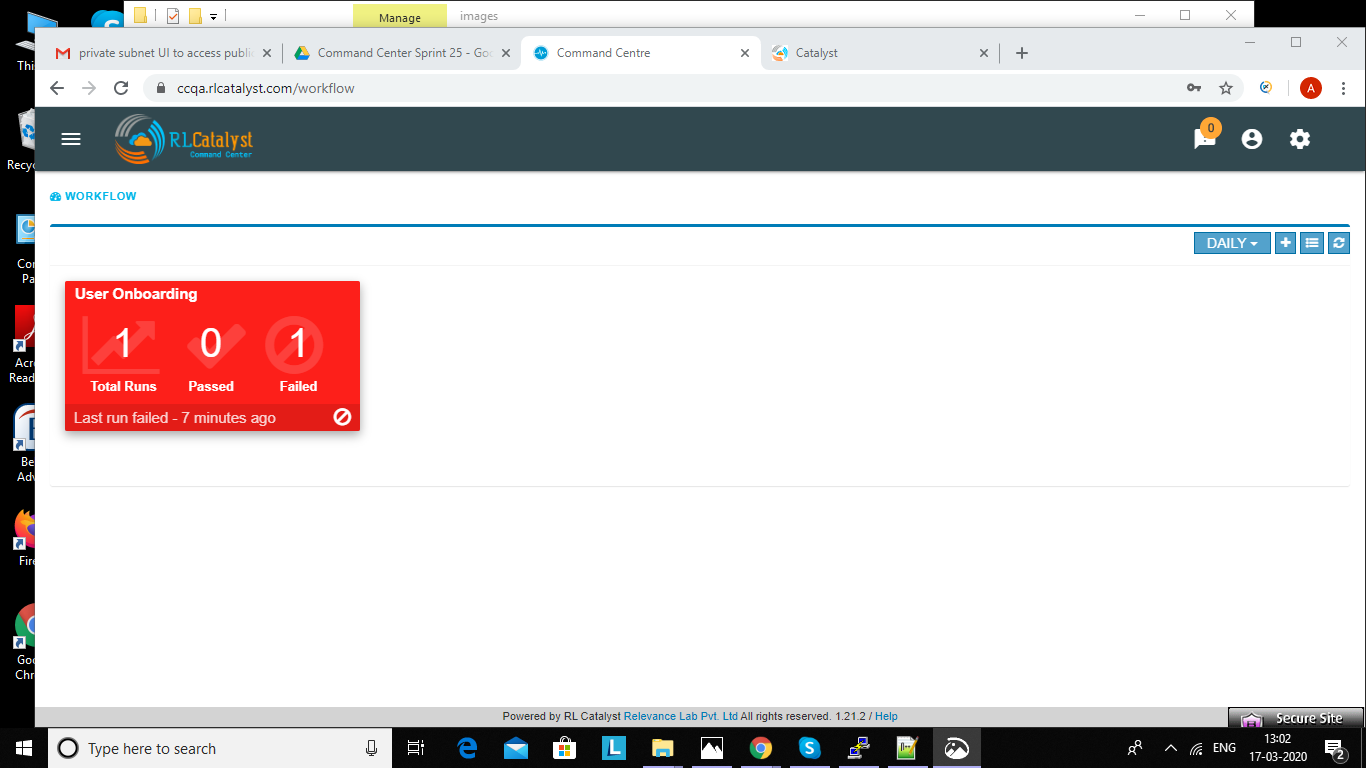
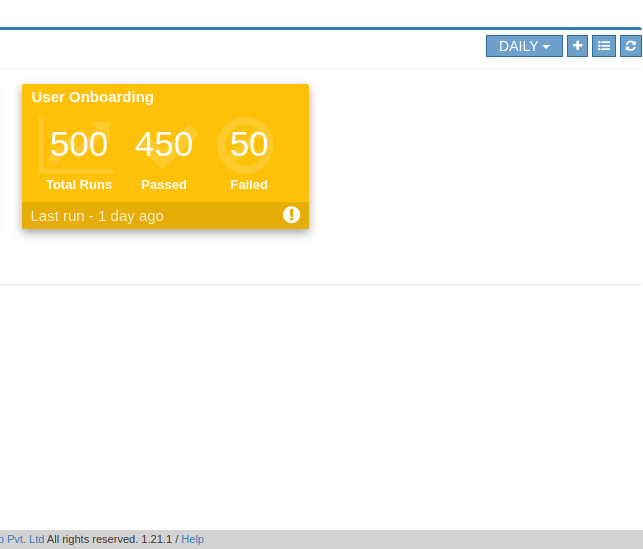
There is tab like “workflows” in main page.when you clicked on that link, it will navigated to workflow monitoring page.On the workflow dashboard page, each workflow is represented by a card which shows the total number of runs completed and passed and failed outcomes.

Initially there are no workflows it shows “No workflows available” message.
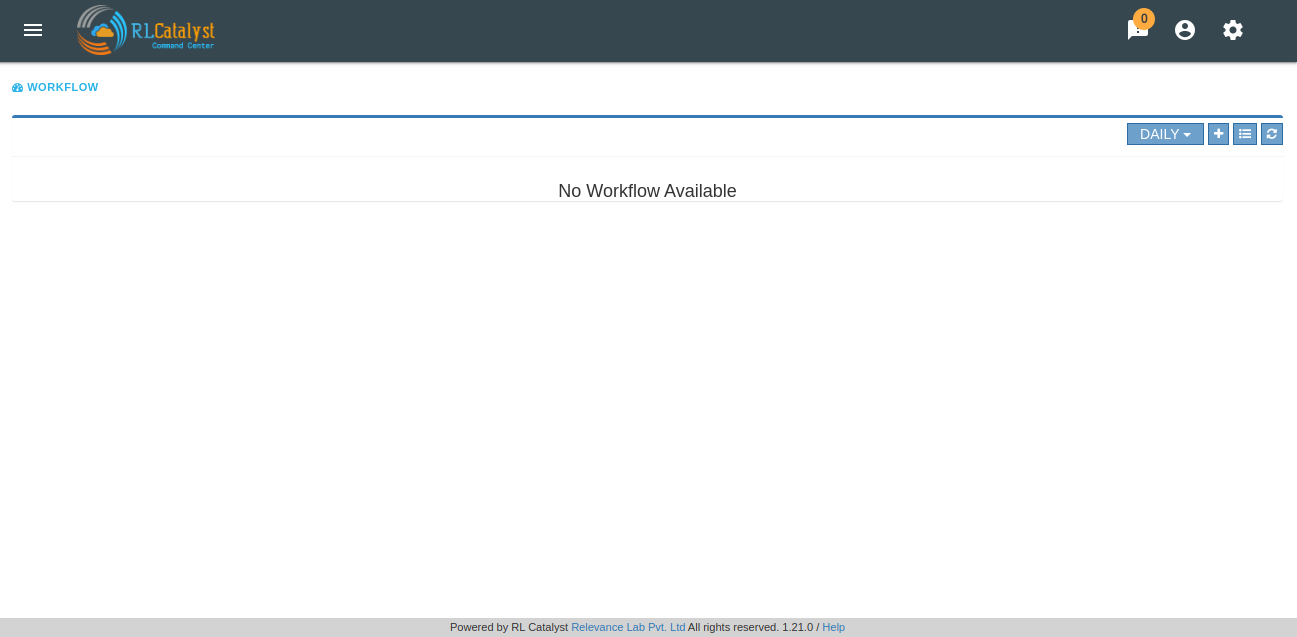
You can add a workflow by clicking on the ‘+’ button.
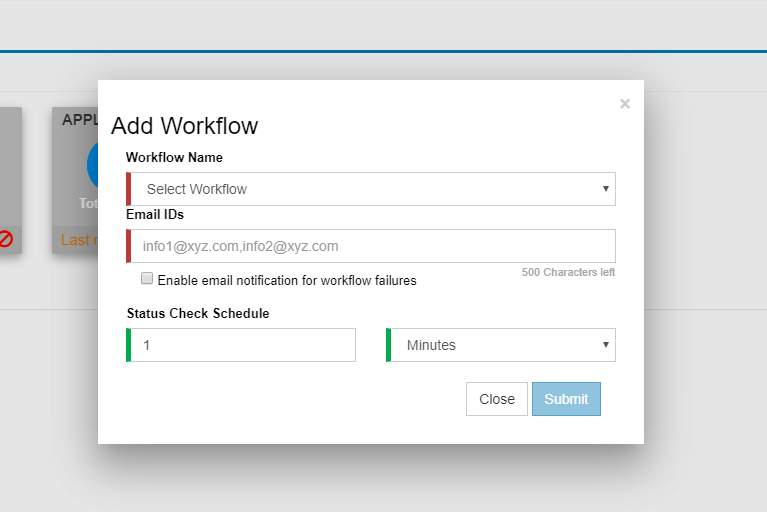
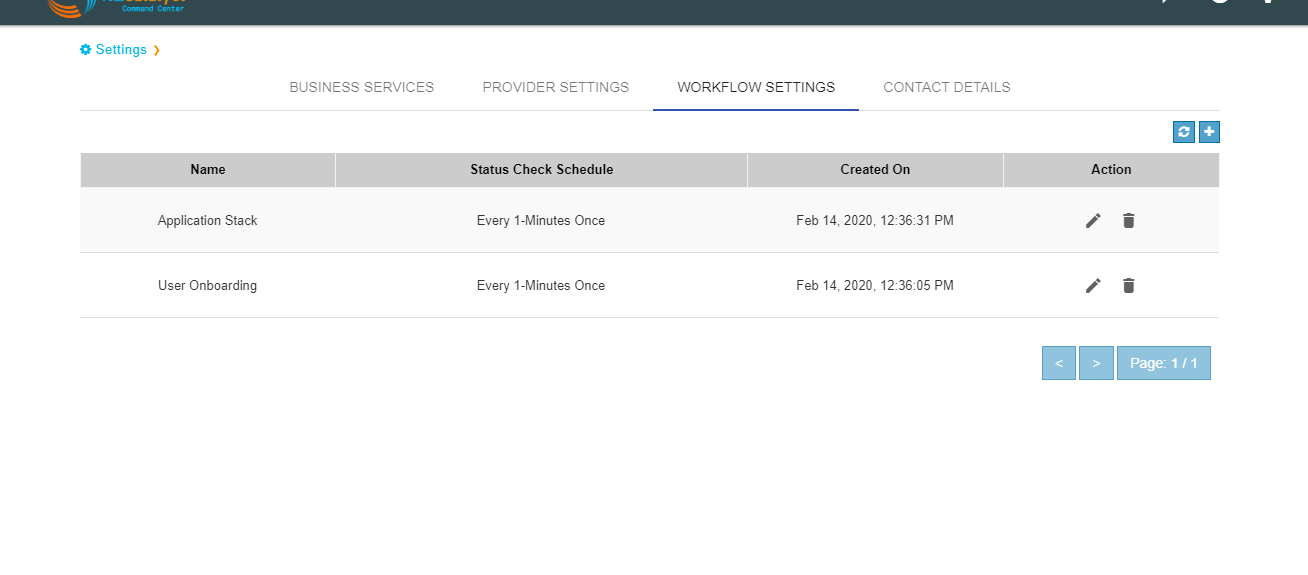
We can add the workflow from Workflow Settings tab on the Settings page. You can also edit or delete the workflow from the Workflow settings tab.
The RLCatalyst Command Center pulls the workflow details from the RLCatalyst Workflow Engine. Only those workflows which are added to the RLCatalyst Workflow Engine, will be available for addition through the “Add Workflow” screen. Once all workflows are added for monitoring, clicking the + button shows “All the workflows are already configured” message.
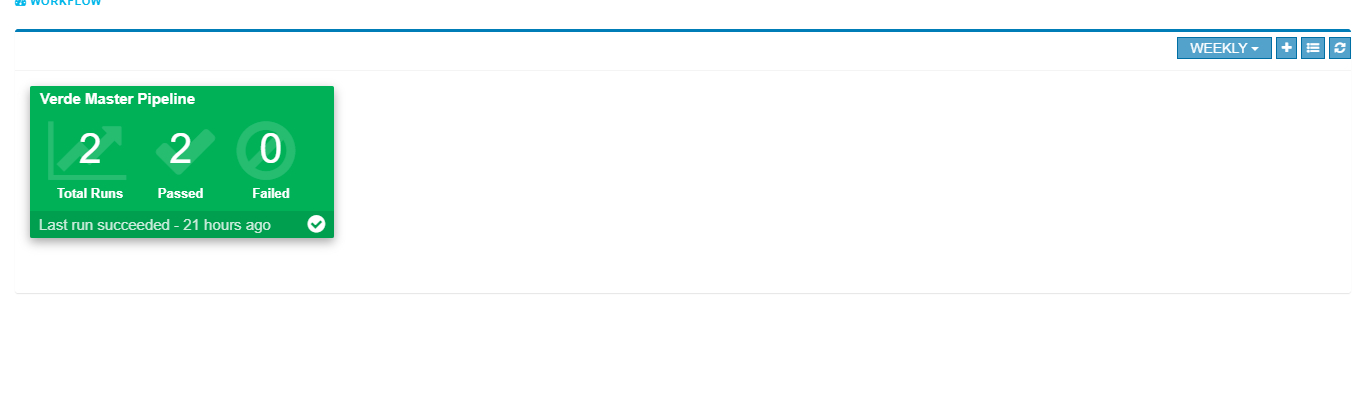
In the workflow Monitoring page navigate to the top right menu there is option called ‘list view’,which shows added workflows are diaplyed in list view.
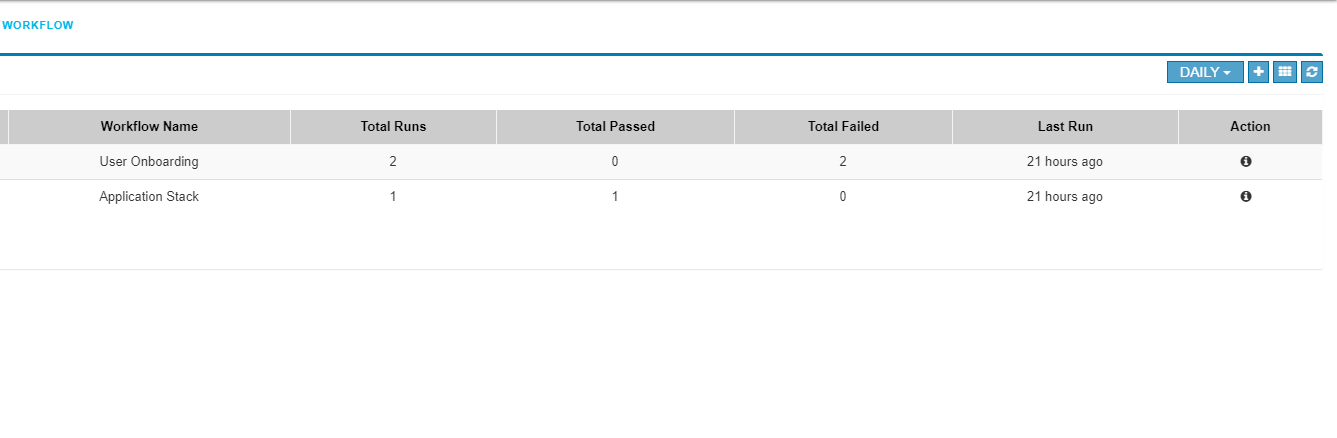
Filters for daily, weekly and monthly views are available on the workflow dashboard screen. Choosing “Daily” filter will show current date data. Similarly we can choose “Weekly” or “Monthly” filters to see the workflow metrics for corresponding periods.
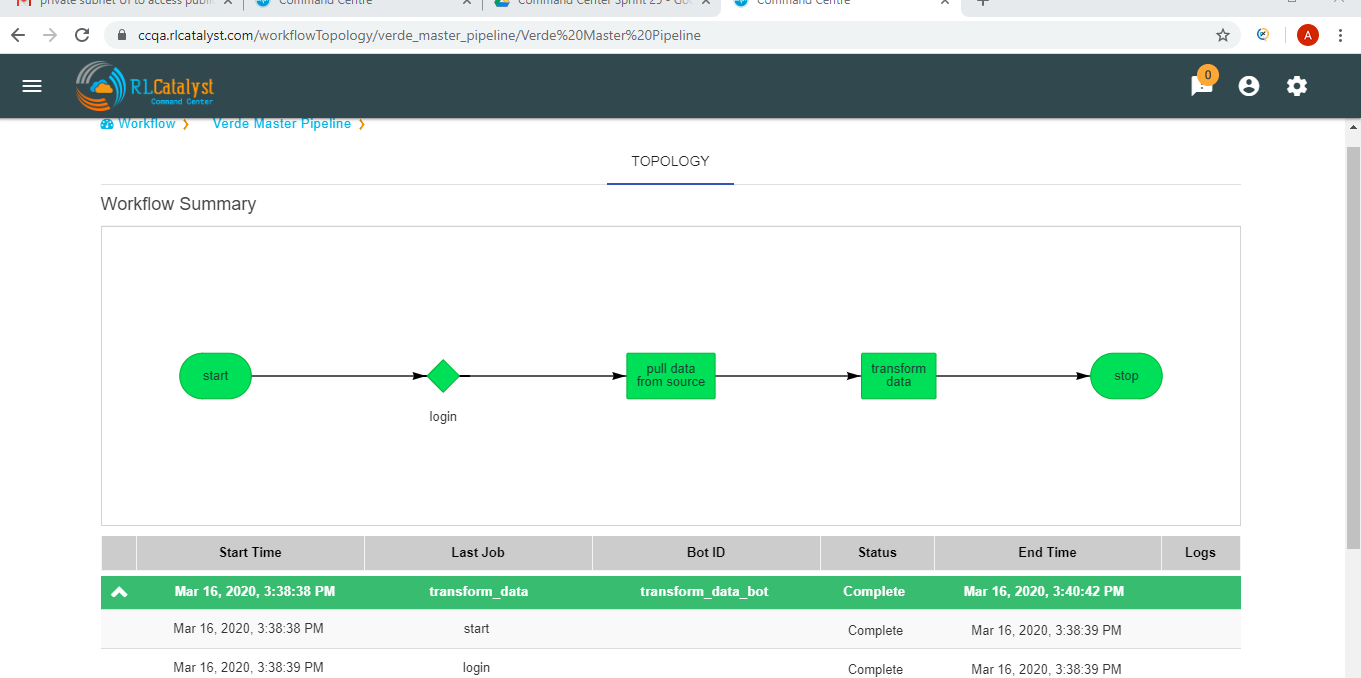
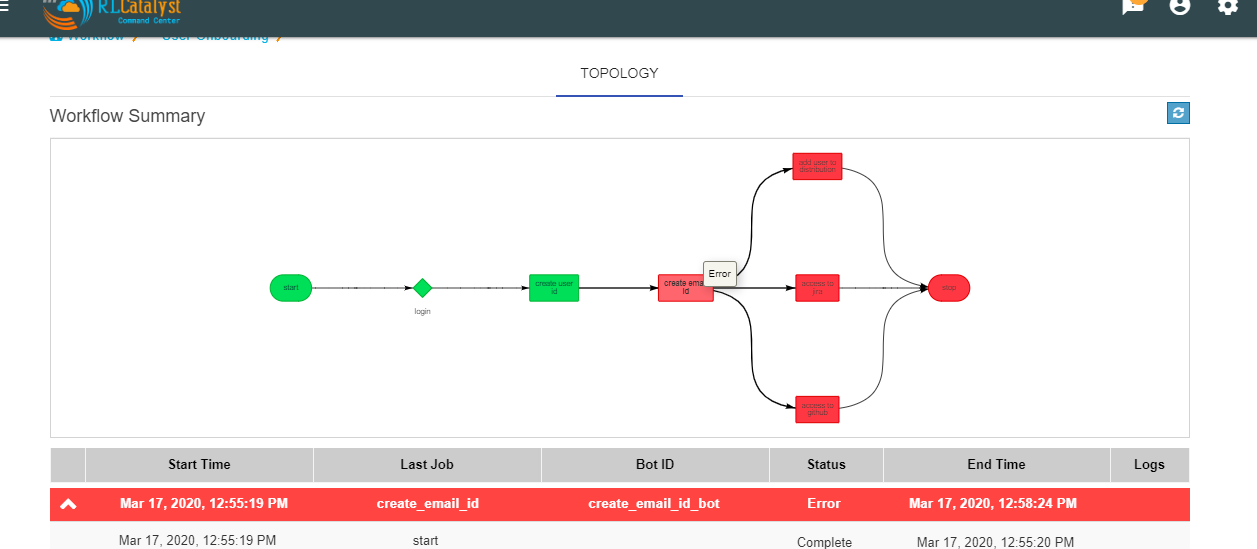
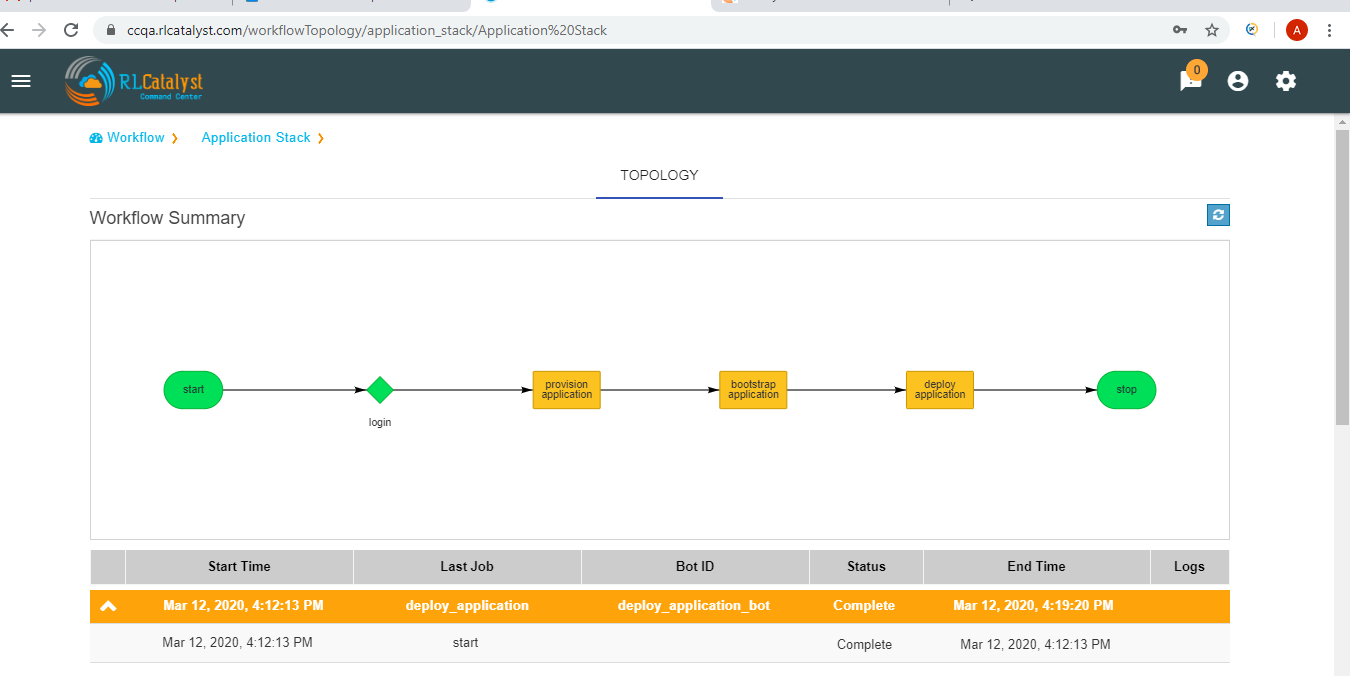
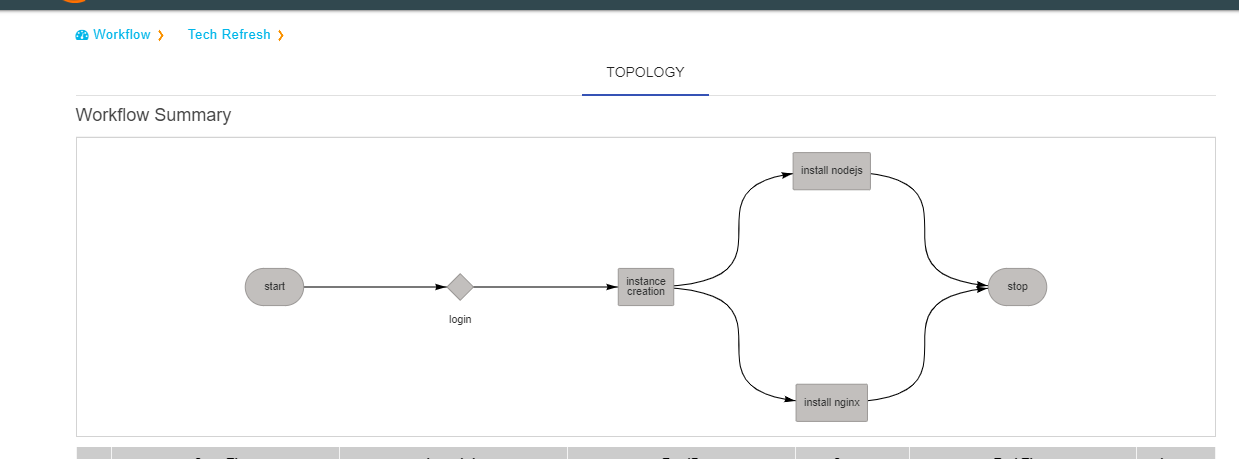
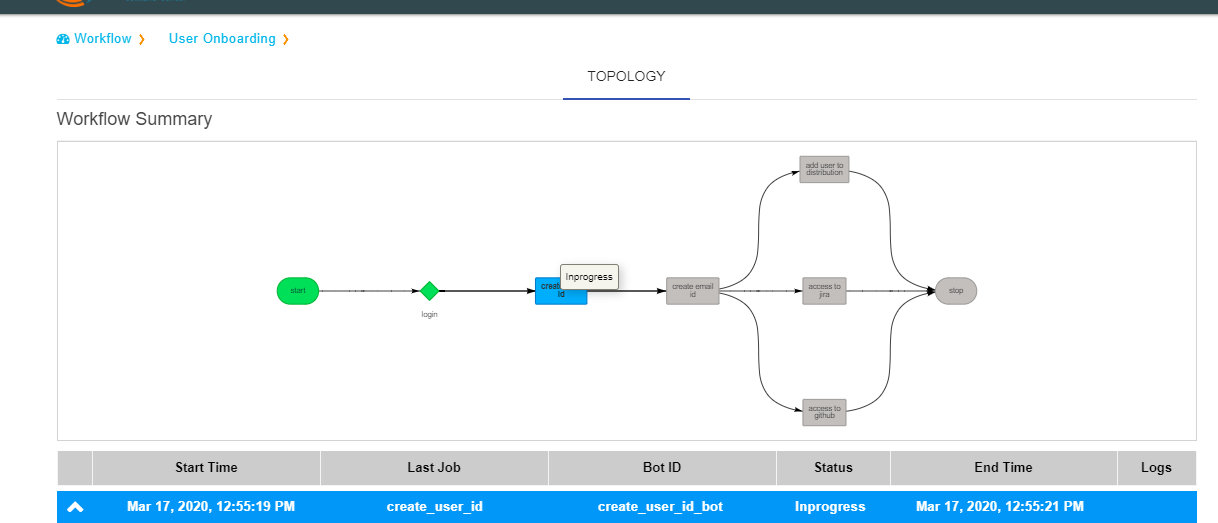
Clicking on a workflow card navigates to workflow details page. On this page the user can see the history of all the workflow runs. The top of the page shows the topology of the workflow run which has been selected from the table below it.When we click on the node see the status of node like tool-tip message.
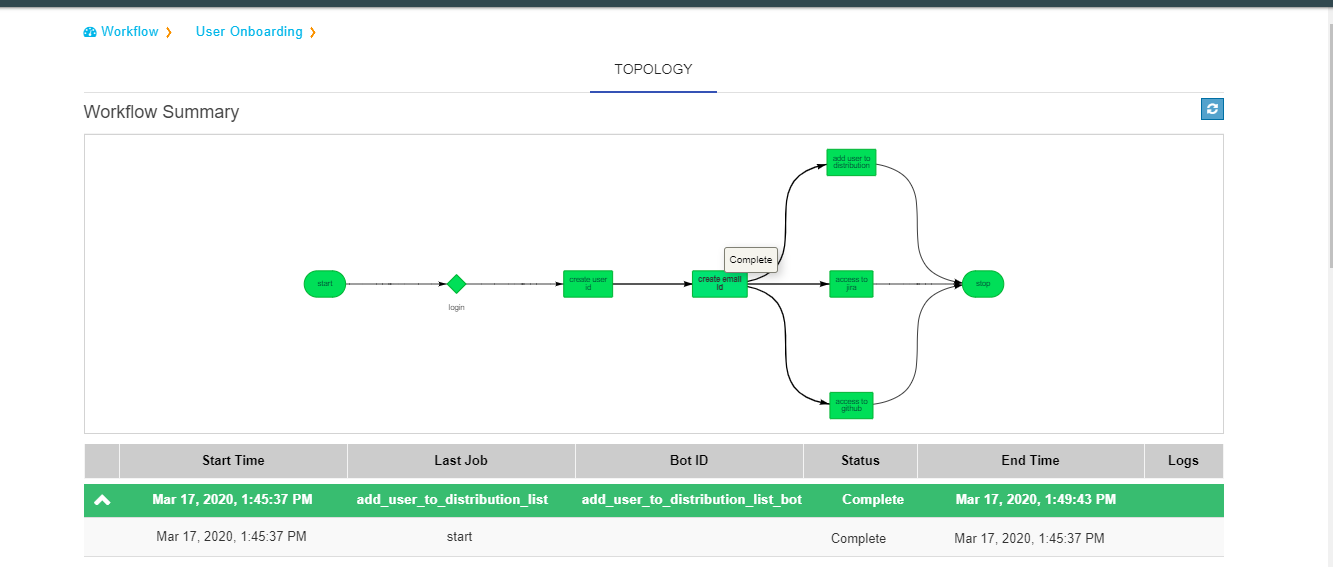
Workflow history details consists following data:
| Start Time | Last Job | Bot ID | Status | End Time | Logs | ||
There is ‘i’ button in the logs,which shows logs about BOTS.
We implemented colour codes for nodes and historical runs table:
A workflow run that completed successfully will show in green color in the table. In the topology view, each node that completed successfully will show in green color.
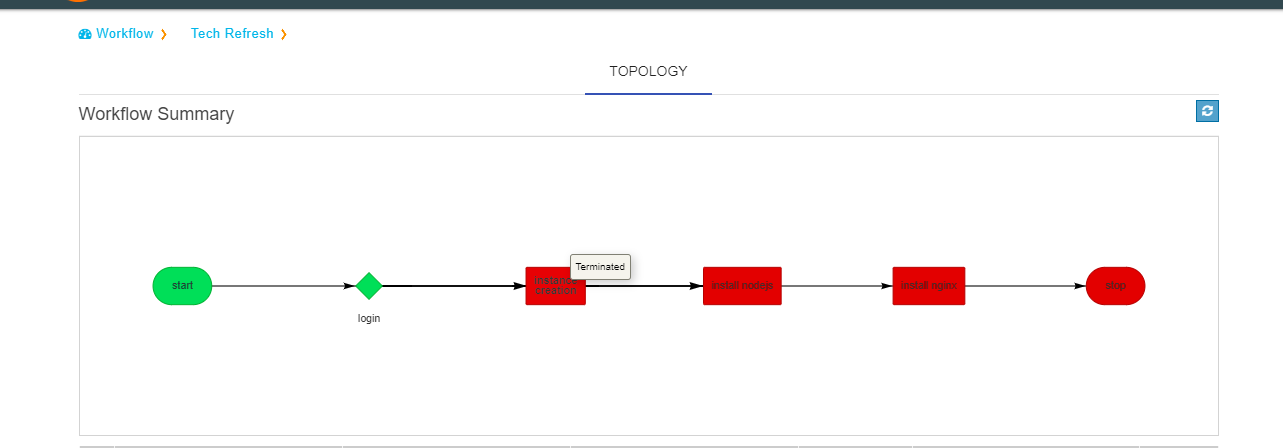
A workflow run that completed with an error will show in red color in the table. In the topology view, the node which completed with error (and all following nodes) will show in terminated status with dark red color. On failure of a workflow run, an e-mail notification will be sent out to the contacts specified in the “Add workflow” screen.
A workfow run is in processing user should also cancelled the workflow.In the topology view, the node which completed with cancelled will show in dark green color

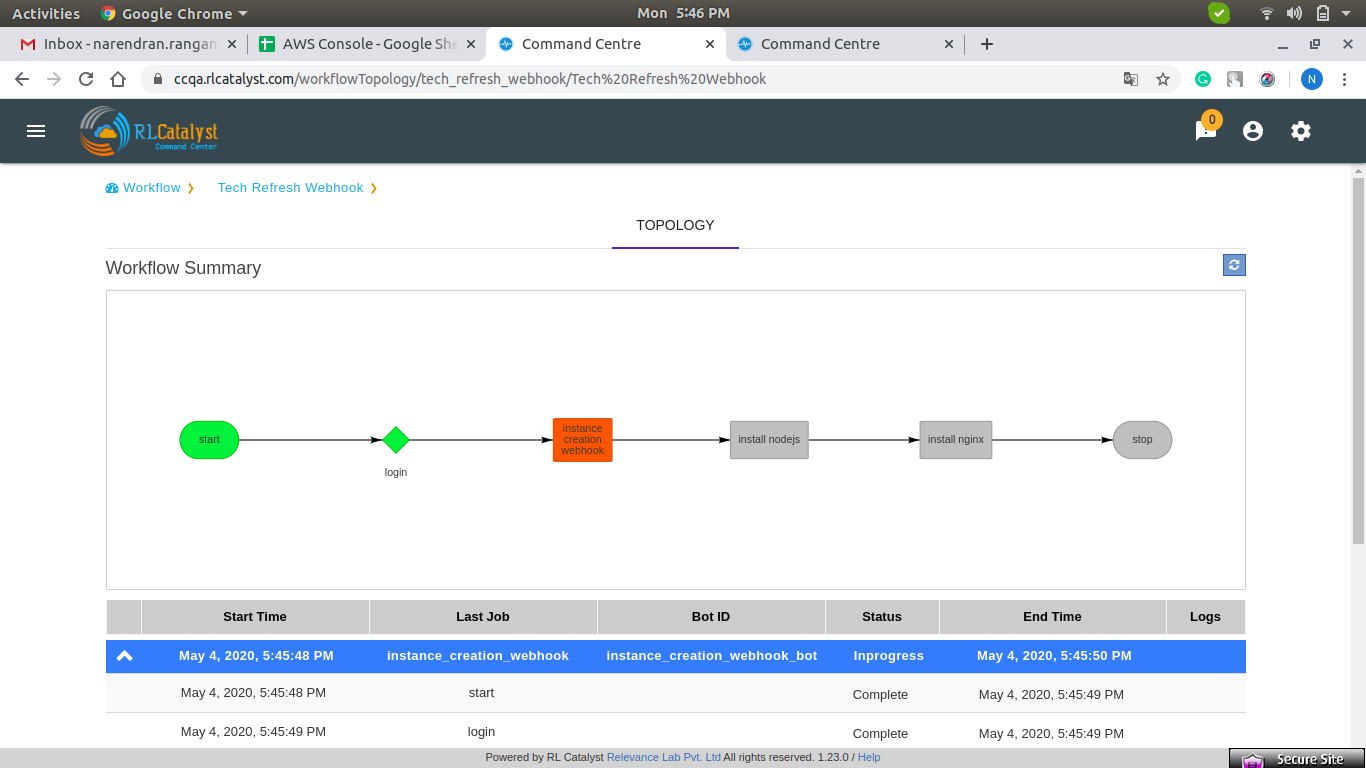
When workflow run is inprocessing due to database connectivity or crash happened.In the topology view, it will shows pause with orange color after some time automatically it will restarts the workflow
A workflow run that is delayed beyond the threshold defined in the RLCatalyst Workflow Engine will show in yellow color. In the topology view, the node which is delayed will show in yellow color. When a node execution is delayed beyond its threshold, an e-mail notification will be sent out to the contacts specified in the “Add workflow” screen.
When there is not history of workflow runs, all the nodes in the topology section will be shown in gray color.
When a node is in progress, the color of the node in topology view will be shown in blue color.
Analytics Page For CPU Metric
It focuses on visualizing the data that we have in ELK(Elastic logstash Kibana) stack, providing analytical recommendations to the users, for detecting the anomalies . We improved this feature for CPU Metric. It consists Visualize,Advanced analytics,Anomaly Detection tabs.
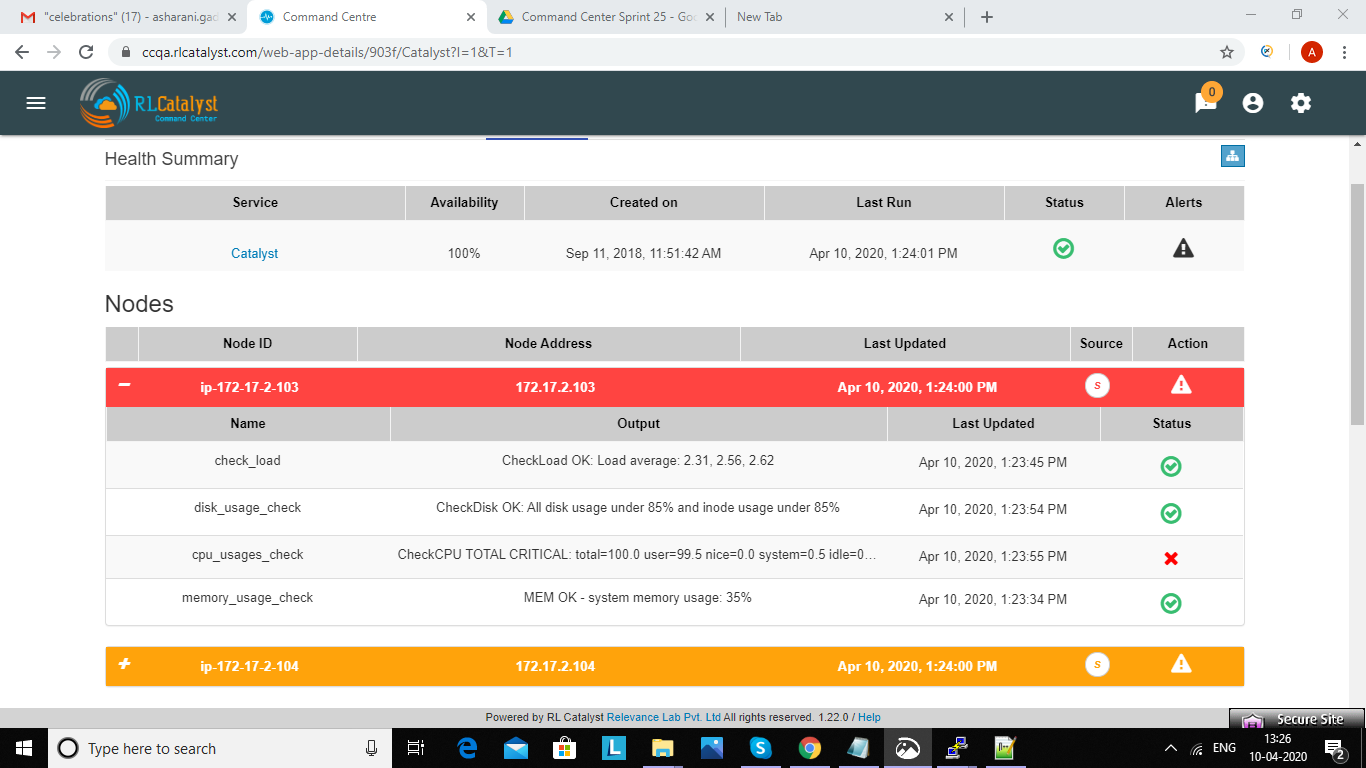
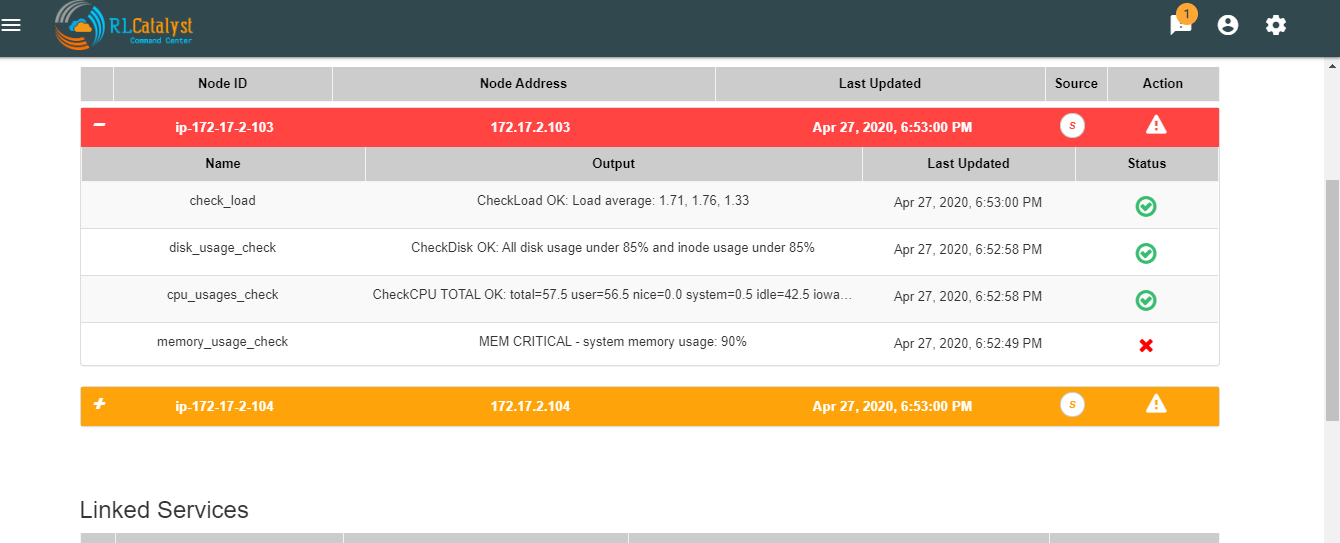
Navigating to analytics page is choose any BSM which leads to health summary details there you can see nodes information.If warning or error alert triggered for cpu_usages_check . We should see “info” icon in status . It navigactes the user to analytics page.If tenant has ELK based configuration than only we should navigated to analytics page.
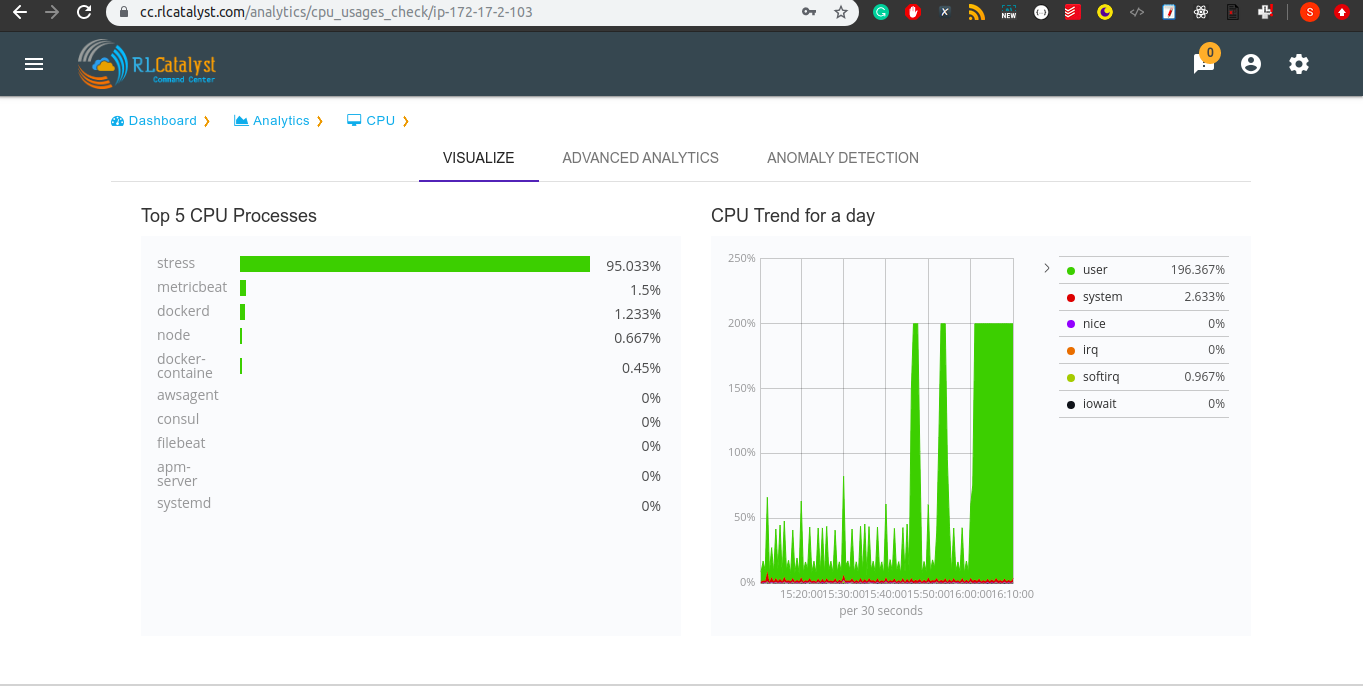
In analytics page we can see visualize tab.It shows top 5 CPU processes whose consume more CPU with percentages and CPU trend for a day in graph model.
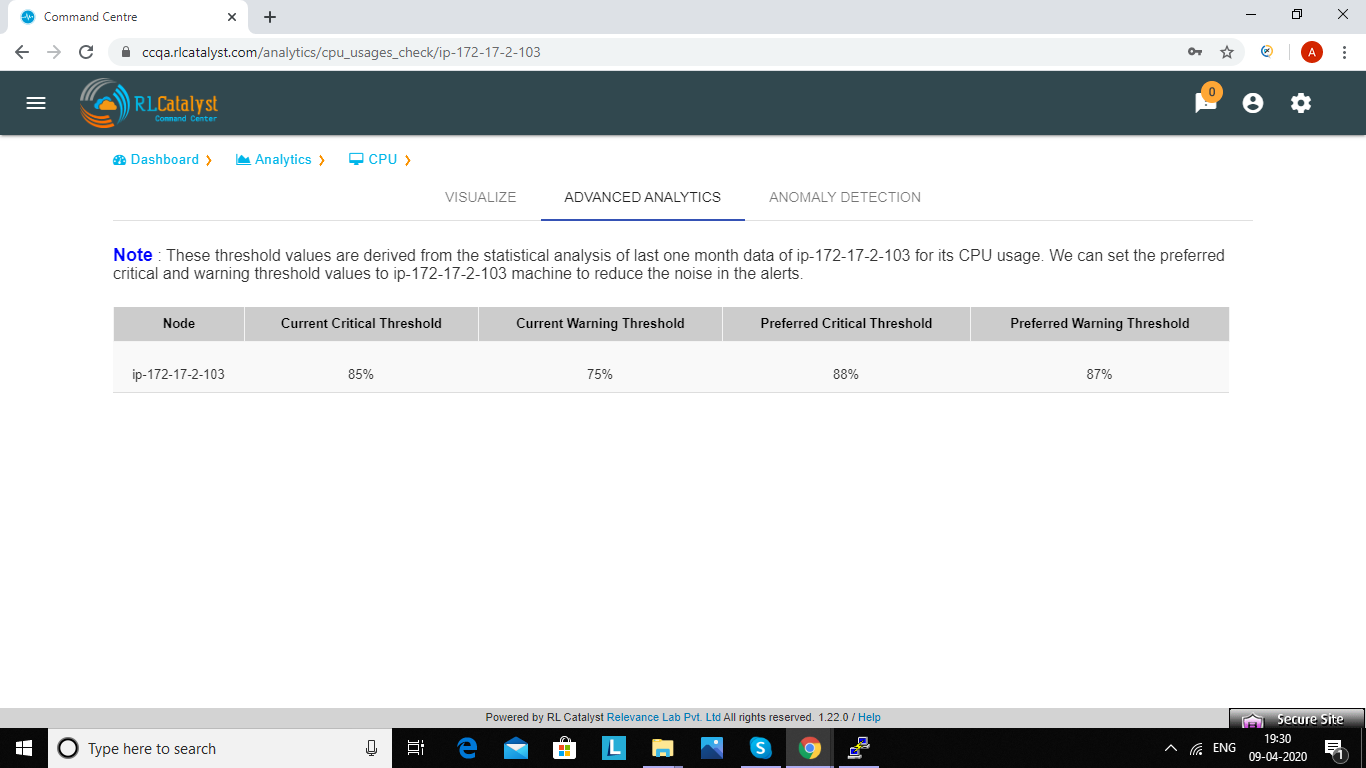
In analytics page we can see Advanced Analytics tab.Here threshold values are derived from the statistical analysis of last one month CPU_usage data of particular node. Based on the threshold values we can reduce the noise in the alerts.It will show proper threshold values for CPU metric of a machine in a table format
| Node | Current critical Threshold | Current Warning Threshold | Preferred Current Threshold | Preferred Warning Threshold | |
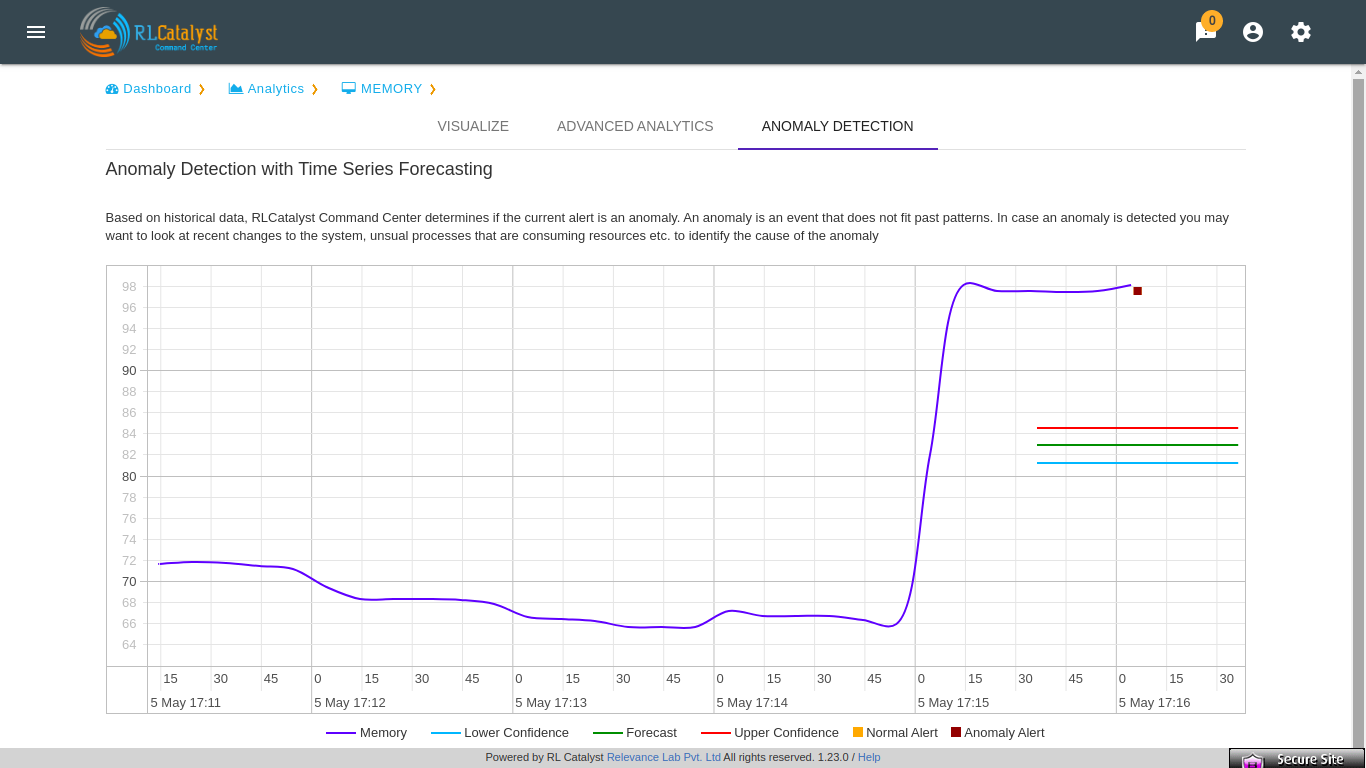
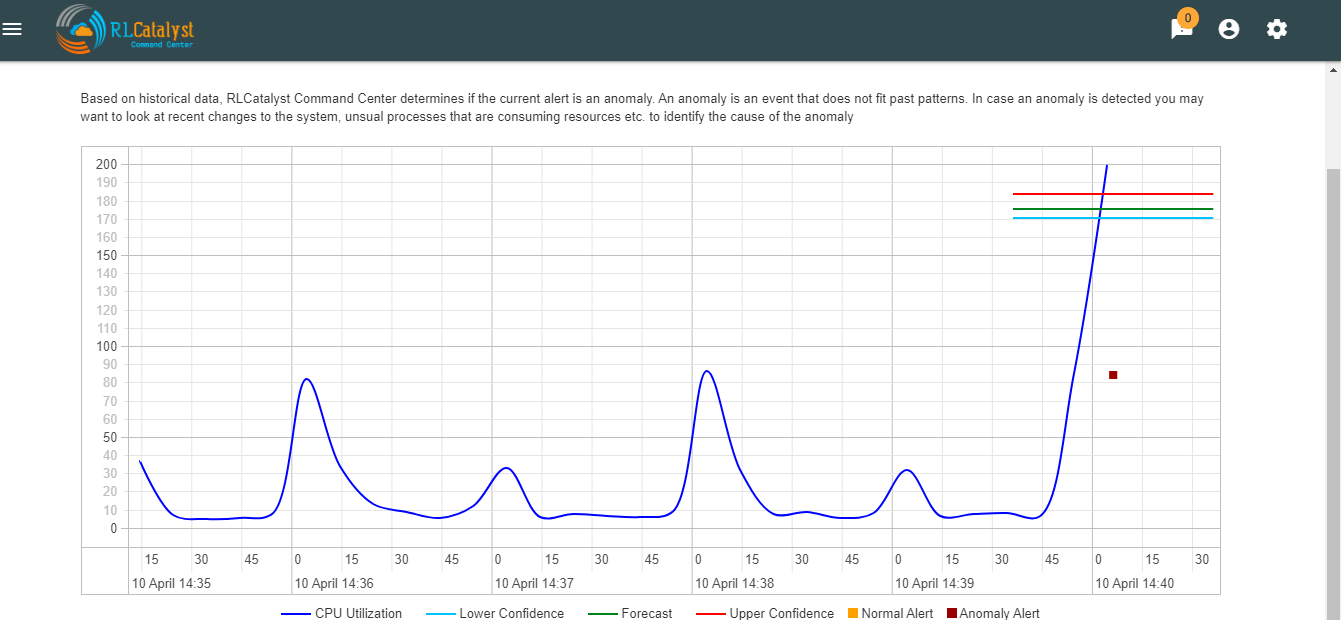
In analytics page we can see Anomaly detection tab.Based on historical data, RLCatalyst Command Center determines if the current alert is an anomaly. An anomaly is an event that does not fit past patterns. In case an anomaly is detected you may want to look at recent changes to the system, unsual processes that are consuming resources etc. to identify the cause of the anomaly
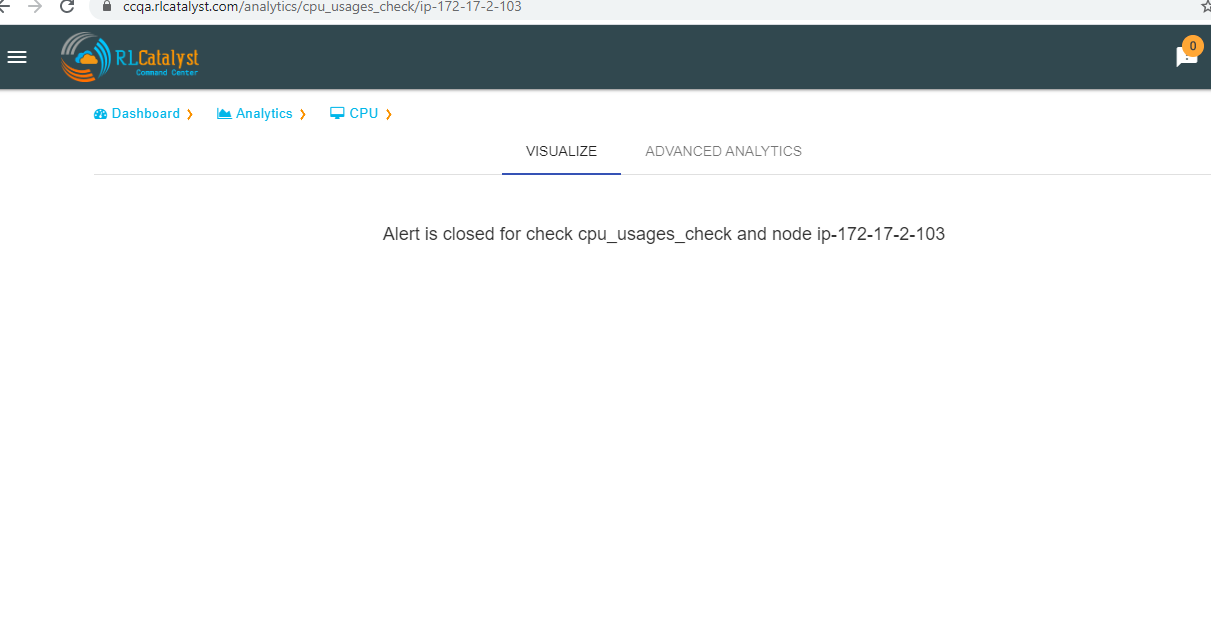
If alert is already resolved than we should see the message like “Alert is closed for check cpu_usages_check and node ip”
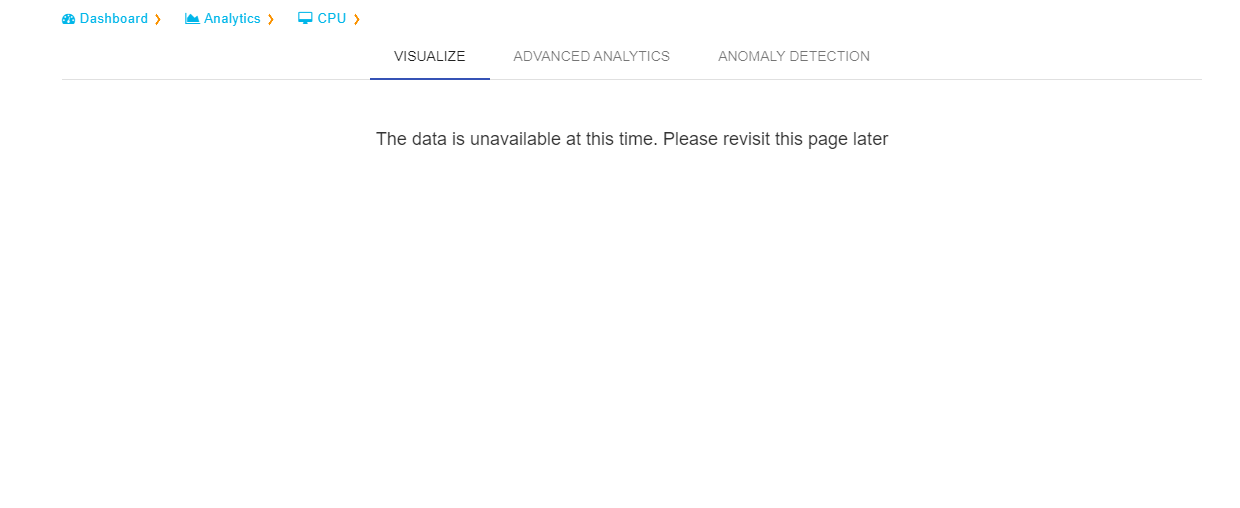
If server is down it shows meassage to user i.e.,”The data is unavailable at this time.please revisit this page later”.
Analytics Page For MEMORY Metric
It focuses on visualizing the data that we have in ELK(Elastic logstash Kibana) stack, providing analytical recommendations to the users, for detecting the anomalies . It consists Visualize,Advanced analytics tabs.
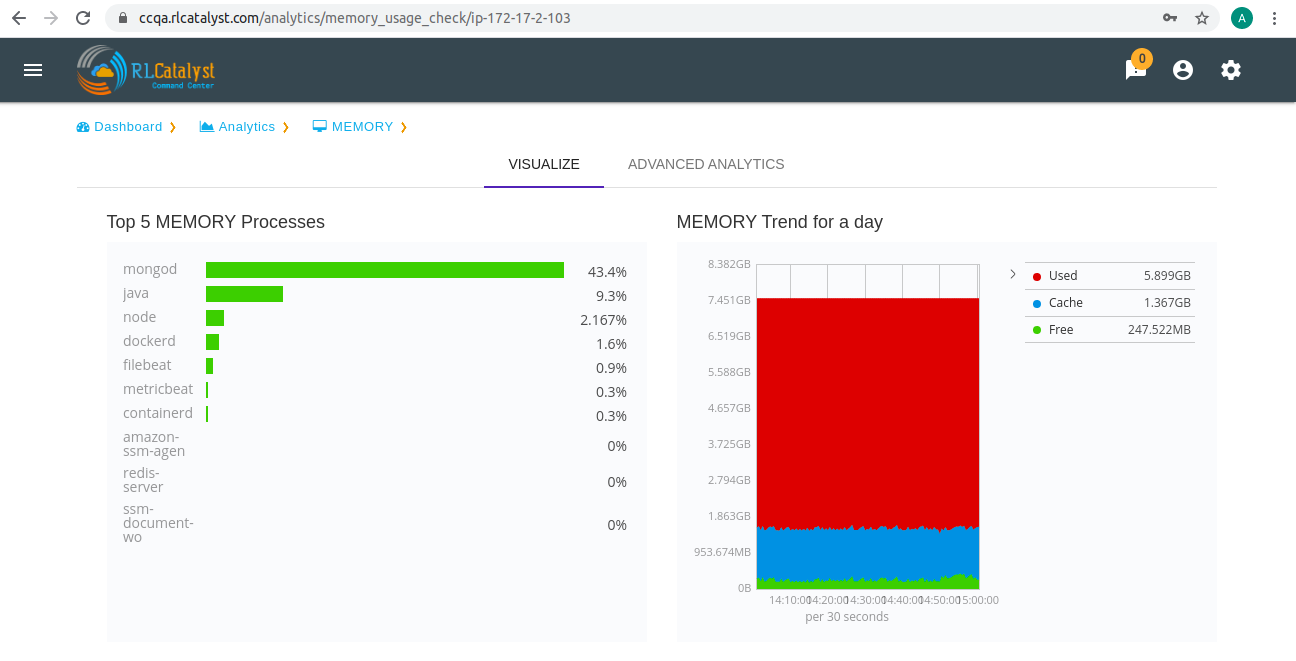
Navigating to analytics page is choose any BSM which leads to health summary details there you can see nodes information.If warning or error alert triggered for Memory_usages_check we should see “info” icon in status . It navigactes the user to analytics page.If tenant has ELK based configuration than only we should navigated to analytics page.
In analytics page we can see visualize tab.It shows top 5 MEMORY processes and MEMORY trend for a day i.e., we can see cache data,free data and used data.
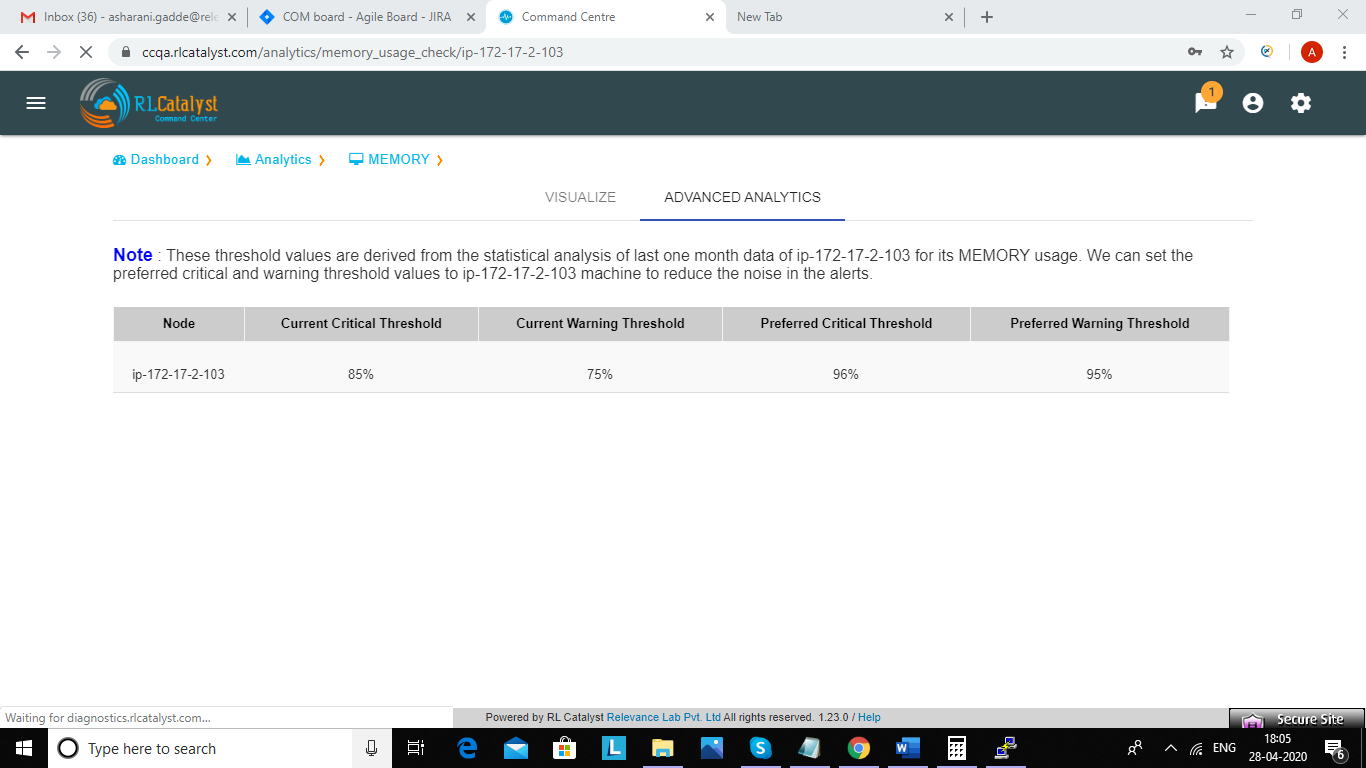
In analytics page we can see Advanced Analytics tab.Here threshold values are derived from the statistical analysis of last one month MEMORY_usage data of particular node. Based on the threshold values we can reduce the noise in the alerts.It will show proper threshold values for MEMORY metric of a machine in a table format
| Node | Current critical Threshold | Current Warning Threshold | Preferred Current Threshold | Preferred Warning Threshold | |
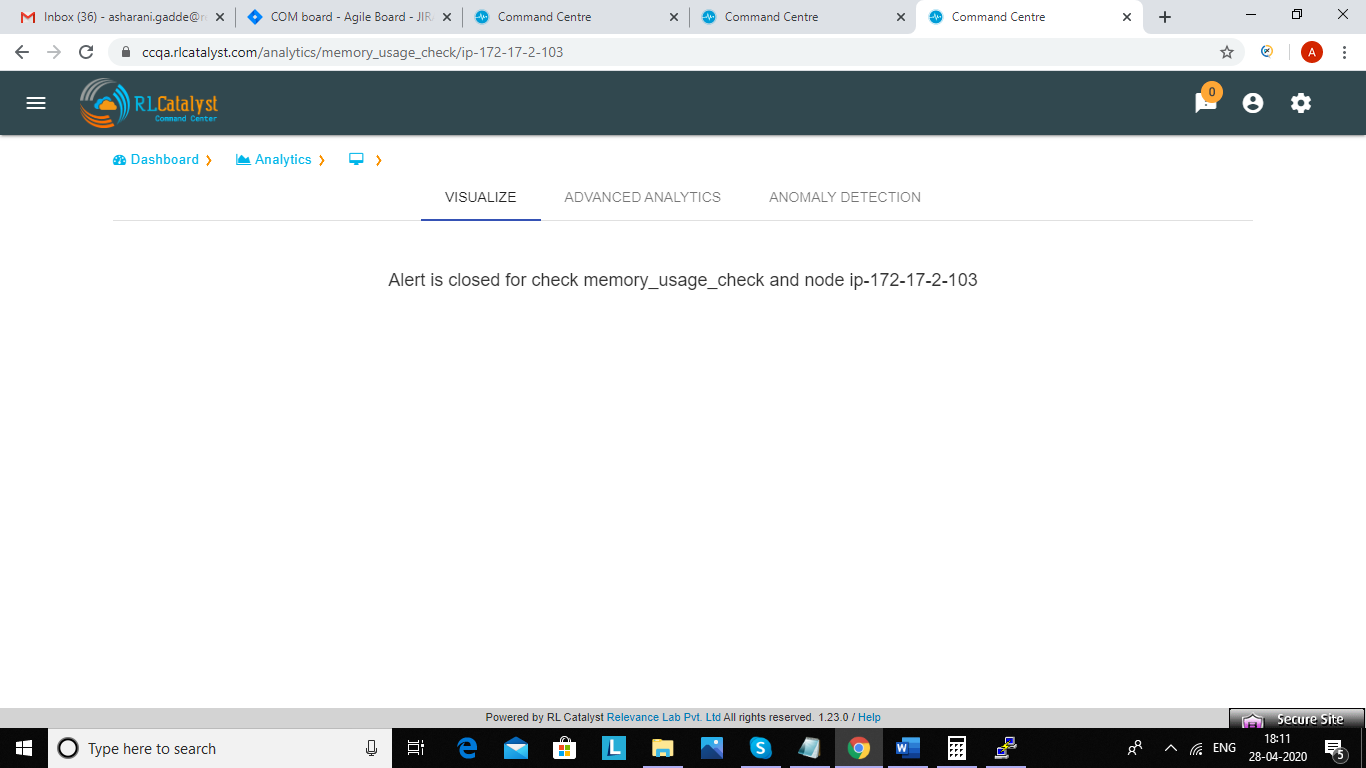
If alert is already resolved than we should see the message like “Alert is closed for check Memory_usages_check and node ip”
If server is down it shows meassage to user i.e.,”The data is unavailable at this time.please revisit this page later”.
In analytics page we can see Anomaly detection tab.Based on historical data, RLCatalyst Command Center determines if the current alert is an anomaly. An anomaly is an event that does not fit past patterns. In case an anomaly is detected you may want to look at recent changes to the system, unusual processes that are consuming resources .