Getting Started
You will be provided the following pieces of information in your starter kit:
| URL | application url |
| Company | |
| User | |
| Password |
Keep this information handy as you go through this guide and configure your system.
Planning your deployment
RLCatalyst Command Center is capable of multi-tenancy. Using the same instance of the software, you can create several tenants. Each tenant can configure his own machines for monitoring. Each tenant can also configure his own cloud accounts and get an independent view of his cloud assets. The landlord can create new tenants in the system.
Creating your first tenant
To plan the creation of a new tenant, use the planning sheet in Appendix A to collect all the information required upfront. Keep the sheet handy as you go through the following steps.
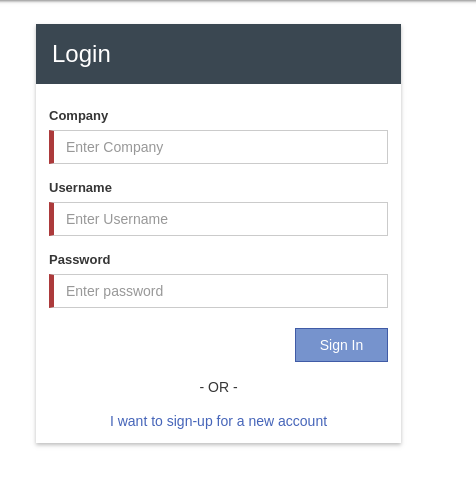
Open a browser (we recommend Chrome or Firefox). Enter the Application URL provided. The login page should open.
To register a tenant, click on the Register link which is available on the login page & application will display Register screen to the user.
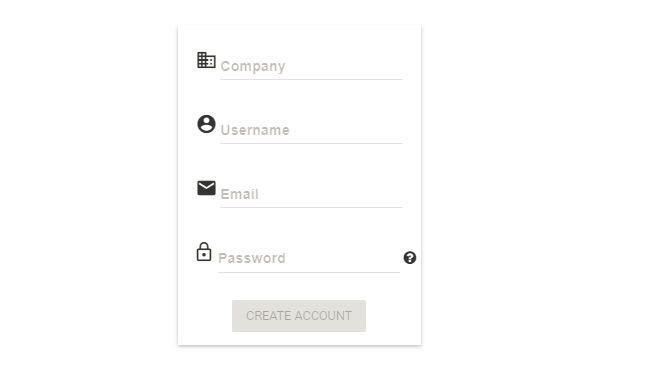
Use details from Appendix A for Company Name, User Name, Email & set the Password as per Password policy. Click on Create Account button. You will see a Thank You screen confirming that a verification email has been sent to the email address registered.
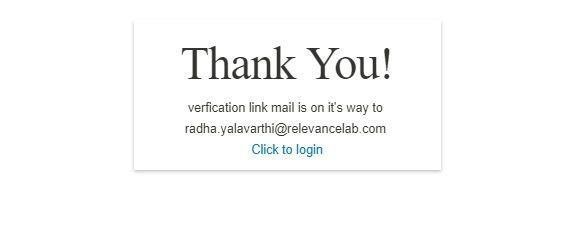
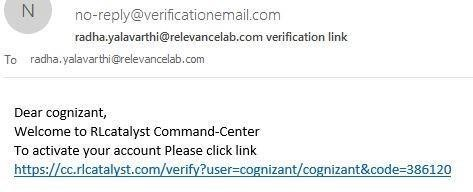
Check the verification email delivered to the registered email address & click on the verification link to activate the account. On successful validation, tenant will be allowed to login into the Command Center.
Logging in as a tenant
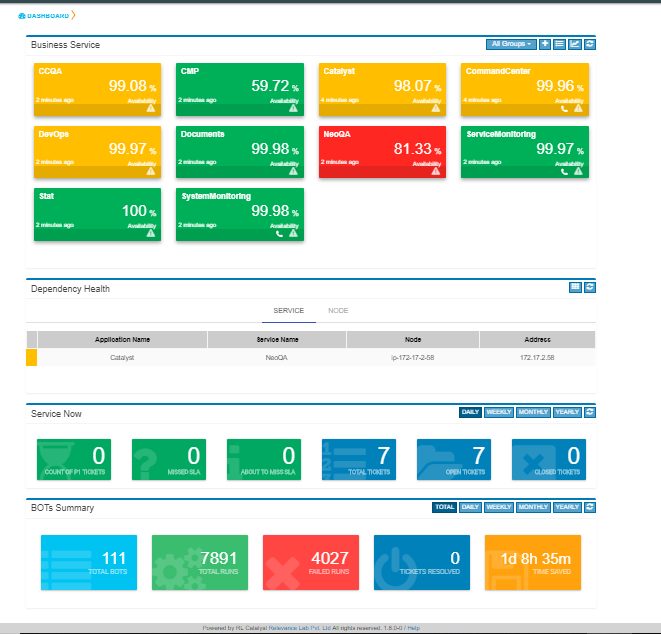
- Open a browser (we recommend Chrome or Firefox). Enter the application URL provided. The login page should open. On the login page, fill the Company, User and Password fields as captured in Appendix A. Then click the Login button. You will see the landing page.
- Business Service Status View – by default this will not show any data. You will need to configure business services following the instructions in this guide.
Service Health – providing a quick way of viewing at a glance, if any of the linked services (across BSM’s) are in alarm state (Yellow & Red). By clicking on critical/warning service card, the system shall navigate to the Services page and should show the Service and Nodes tabs related to selected service.
ServiceNow Ticket Snapshot – by default this will not show any data. You will need to configure a Service Now account following the instructions in this guide.
BOT’s Summary (Total)- We need to configure a Catalyst Account to view the count of Bot’s summary.
Configuring Cloud Credentials
RLCatalyst Command Centre gives you the ability to view all your cloud assets (spanning across providers and accounts) in one place. These assets include
- Virtual Machines
- ELBs
- Security Groups
- Networks
Configure your Cloud Account Details in the Command Centre Settings to view all your cloud assets in one place. Command Centre collects the information from the configured cloud account periodically. You can configure the interval in which this information refreshes.
In Provider Settings, we have categorized the providers based on their services. Depends on Category selection Provider List will load the available vendors.
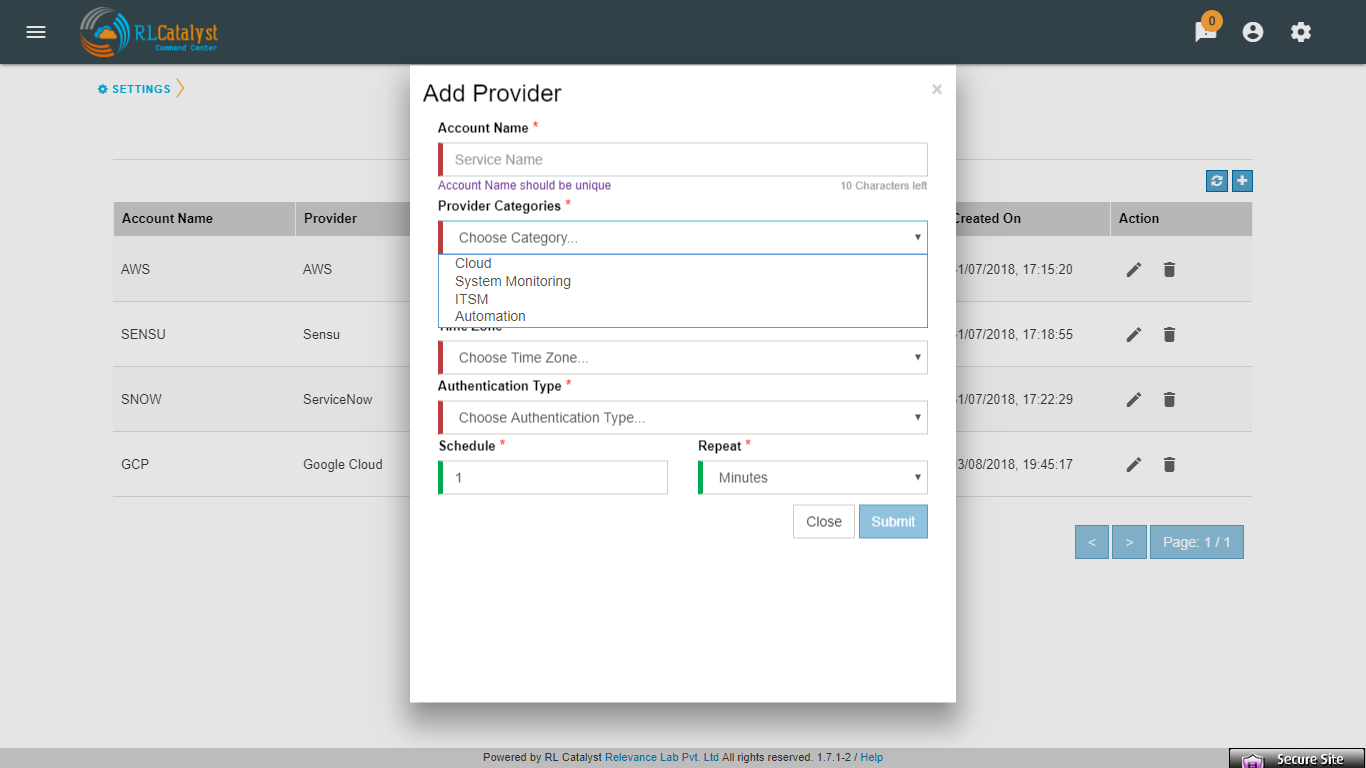
- Command Center will support for following Cloud Account providers.
- Microsoft Azure
- AWS
- Google Cloud
- DigitalOcean
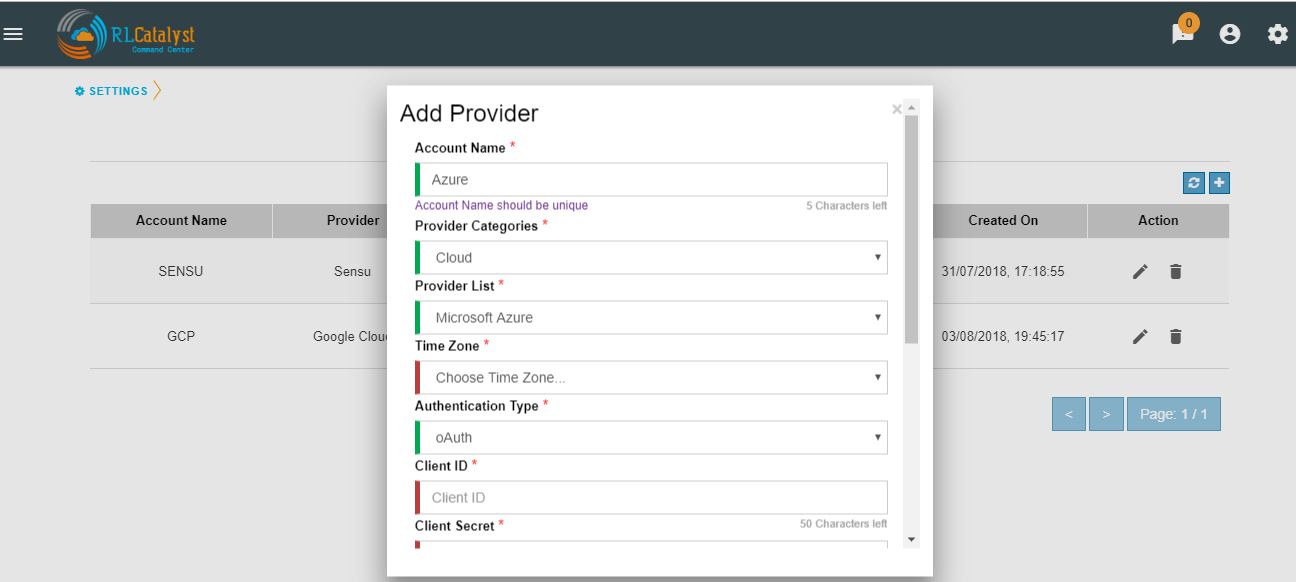
To configure a Azure cloud account
- Click on the Settings icon in the top bar
- Click on the Provider Settings tab
- Click + button and add your cloud account credentials in Settings with the details captured in Appendix A. Example provided below is for a Microsoft Azure account.
| Field | Instructions |
|---|---|
| Account Name | Enter a Friendly name |
| Provider Categories | Choose Cloud |
| Provider Categories | Choose Microsoft Azure |
| Time Zone | Choose IST |
| Authentication Type | Choose OAuth |
| Client ID | Enter the Client ID of your Azure application E.g.: 9812d575-dja-4b48-8434-hdgh |
| Client Secret | Enter the Secret key of your Azure Application |
| Grant Type | Enter the text ‘client credentials’ |
| Resource | https://management.azure.com/ |
Enter the Azure subscription ID | +—————————–+———————————————————————————+ | Tenant ID | Enter the Azure Tenant ID | +—————————–+———————————————————————————+ | Schedule | Enter the Time Interval for collecting data from Cloud | +—————————–+———————————————————————————+ | Repeat | Choose the Interval Type – Minutes/Hourly | +—————————–+———————————————————————————+
Note: To get the Client ID and Client Secret key, create an application in Azure and set the Role as Reader. To set the Role, Go to Subscription->Resource Group->Access Control(IAM)->Add>Permissions->Add Reader Permission
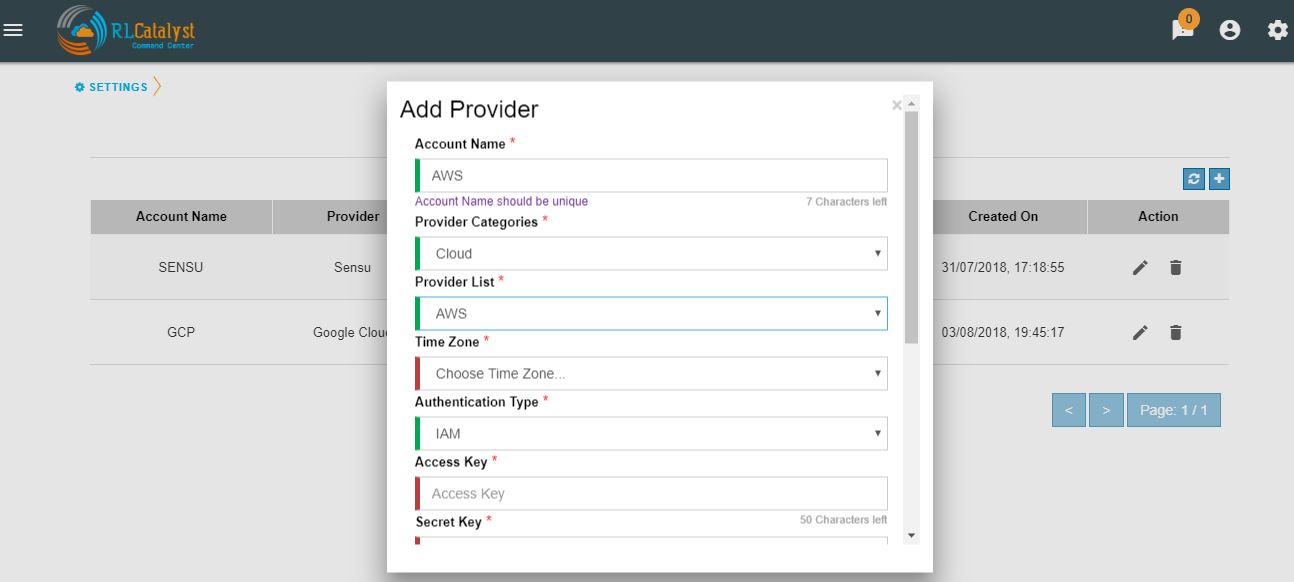
To configure a AWS cloud account
- Click on the Settings icon in the top bar
- Click on the Provider Settings tab
- Click + button and add your cloud account credentials in Settings with the details captured in Appendix A. Example provided below is for a AWS account.
| Field | Instructions |
|---|---|
| Account Name | Enter a Friendly name |
| Provider Categories | Choose Cloud |
| Provider List | Choose AWS |
| Time Zone | Choose IST |
| Authentication Type | Choose IAM |
| Access Key | Enter the Access Key of your AWS Application |
| Secret Key | Enter the Secret key of your AWS Application |
| Region | Enter the Region of your AWS Application |
| Account Number | Enter the Account Number of AWS Application |
Choose the required options | +—————————–+———————————————————————————+ | Schedule | Enter the Time Interval for collecting data from Cloud | +—————————–+———————————————————————————+ | Repeat | Choose the Interval Type – Minutes/Hourly | +—————————–+———————————————————————————+
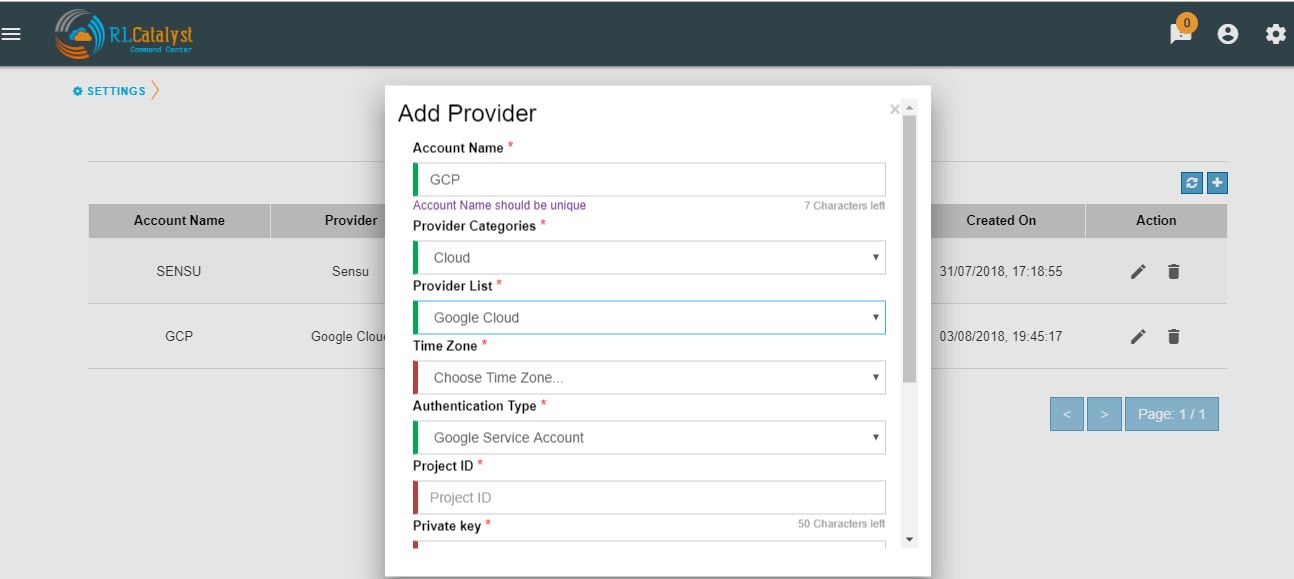
To configure a Google cloud account
- Click on the Settings icon in the top bar
- Click on the Provider Settings tab
- Click + button and add your cloud account credentials in Settings with the details captured in Appendix A. Example provided below is for a Google Cloud account.
| Field | Instructions |
|---|---|
| Account Name | Enter a Friendly name |
| Provider Categories | Choose Cloud |
| Provider List | Google Cloud |
| Time Zone | Choose IST |
| Authentication Type | Choose Google Service Account |
| Project ID | Enter the Project ID of your Google application |
| Private Key | Enter the Private key of your Google Application |
| Client Email | Enter the email of client generated email |
| Client Certificate URL | Enter the client generated URL |
| Schedule | Enter the Time Interval for collecting data from Cloud |
| Repeat | Choose the Interval Type – Minutes/Hourly |
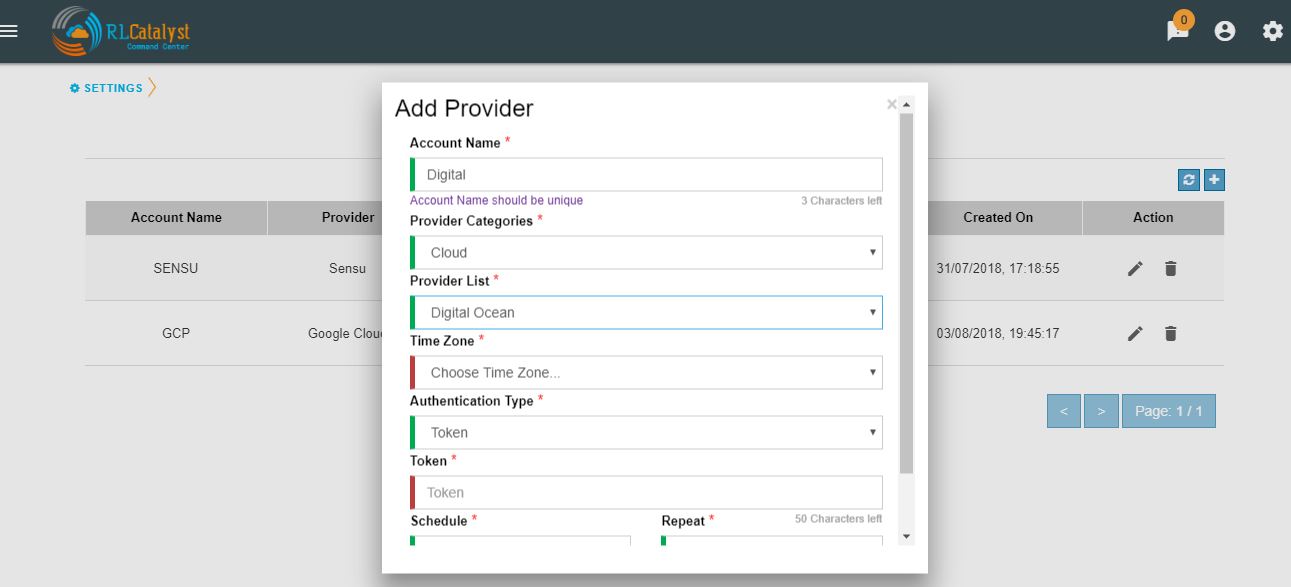
To configure a DigitalOcean cloud account
- Click on the Settings icon in the top bar
- Click on the Provider Settings tab
- Click + button and add your cloud account credentials in Settings with the details captured in Appendix A. Example provided below is for a DigitalOcean account.
| Field | Instructions |
|---|---|
| Account Name | Enter a Friendly name |
| Provider Categories | Choose Cloud |
| Provider List | Choose Digital Ocean |
| Time Zone | Choose IST |
| Authentication Type | Choose Token |
| Token | Enter the token of your Digital Ocean application |
| Schedule | Enter the Time Interval for collecting data from Cloud |
| Repeat | Choose the Interval Type – Minutes/Hourly |
Configuring ITSM Credentials
Add ITSM service in provider settings, It will raise incident when service is down or not available. After adding ITSM, Dashboard and ITSM menu will update with cards. Clicking on the card will display the data regarding the particular card. ITSM will provide the direct link to the ITSM provider as whenever we select any incident it will redirect to the particular ITSM service.
- Command Center will support for following ITSM providers.
- ServiceNow
- FreshService
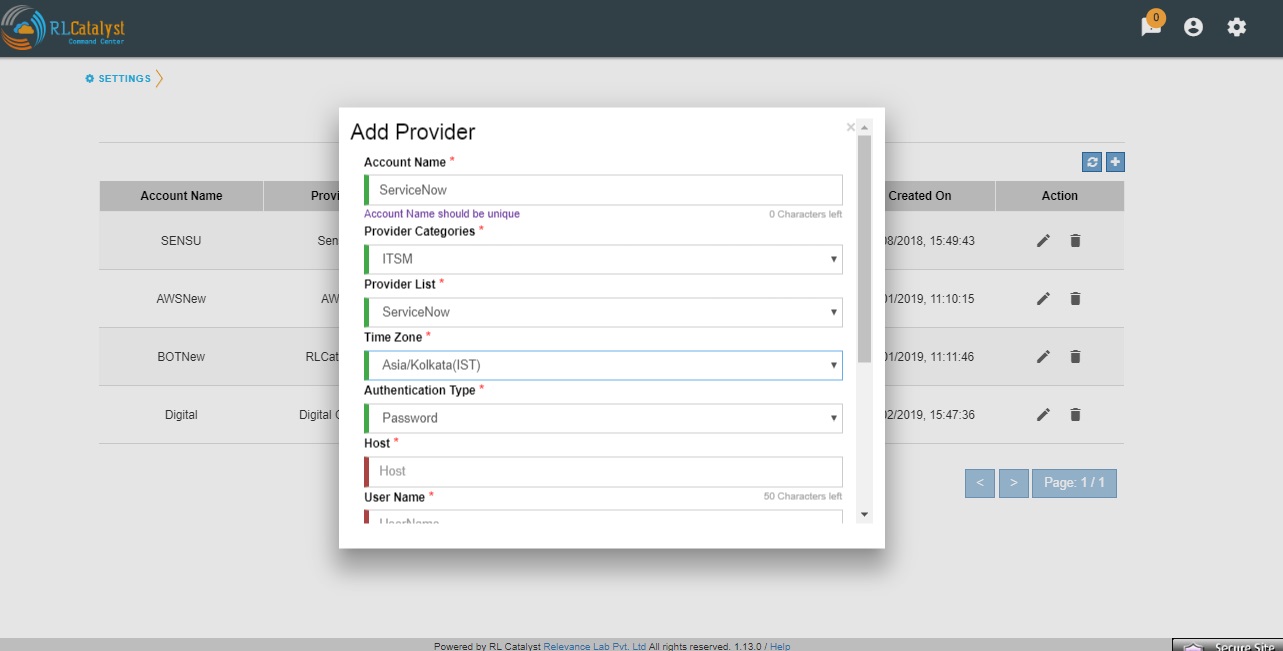
To configure a ServiceNow account
- Click on the Settings icon in the top bar
- Click on the Provider Settings tab
- Click + button and add your ITSM account credentials in Settings with the details captured in Appendix A. Example provided below is for a ServiceNow account.
| Field | Instructions | |
|---|---|---|
| Account Name | Enter a Friendly name | |
| Provider Categories | Choose ITSM | |
| Provider List | Choose ServiceNow | |
| Time Zone | Choose IST | |
| Authentication Type | Password | |
| Host | URL to your ServiceNow Instance E.g.:ven01746.service-now.com | |
| UserName | Enter UserName | |
| Password | Enter Password | |
| Schedule | Enter the Time Interval for collecting data from Catalyst | |
| Repeat | Choose the Interval Type-Minutes/Hourly | |
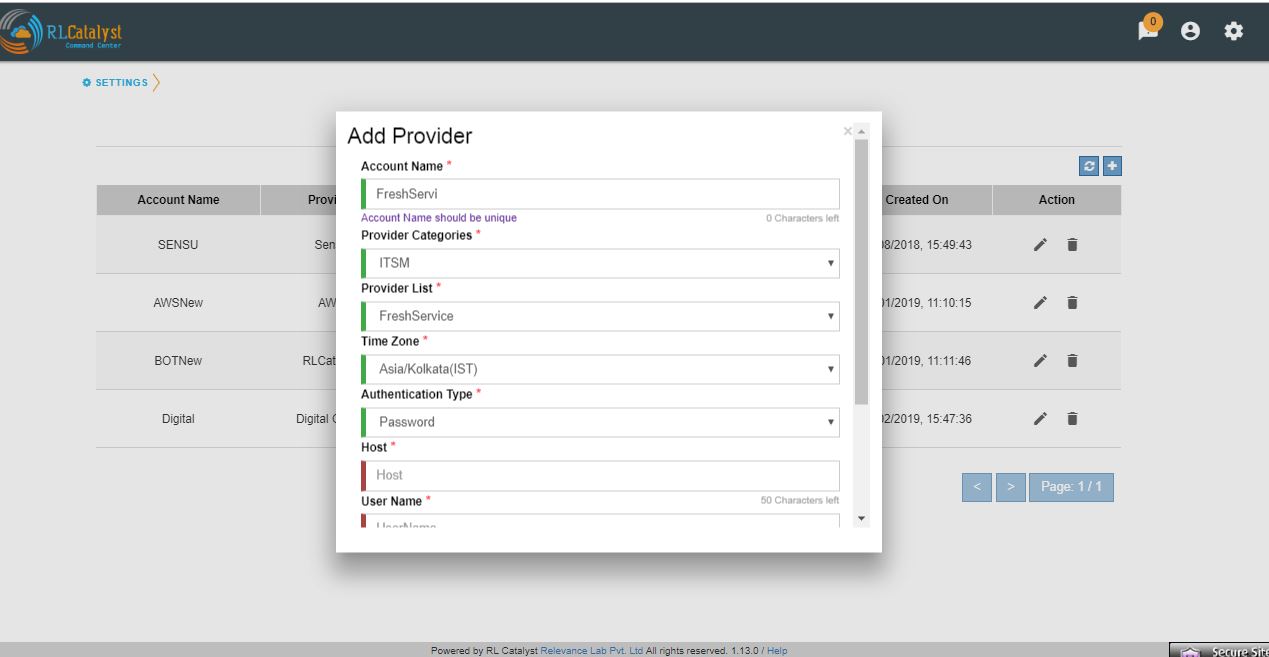
To configure a FreshService account
- Click on the Settings icon in the top bar
- Click on the Provider Settings tab
- Click + button and add your ITSM account credentials in Settings with the details captured in Appendix A. Example provided below is for a FreshService account.
| Field | Instructions | |
|---|---|---|
| Account Name | Enter a Friendly name | |
| Provider Categories | Choose ITSM | |
| Provider List | Choose FreshService | |
| Time Zone | Choose IST | |
| Authentication Type | Password | |
| Host | URL to your FreshService Instance E.g.https://rlab.freshservice.com | |
| UserName | Enter UserName | |
| Password | Enter Password | |
| Schedule | Enter the Time Interval for collecting data from Catalyst | |
| Repeat | Choose the Interval Type-Minutes/Hourly | |
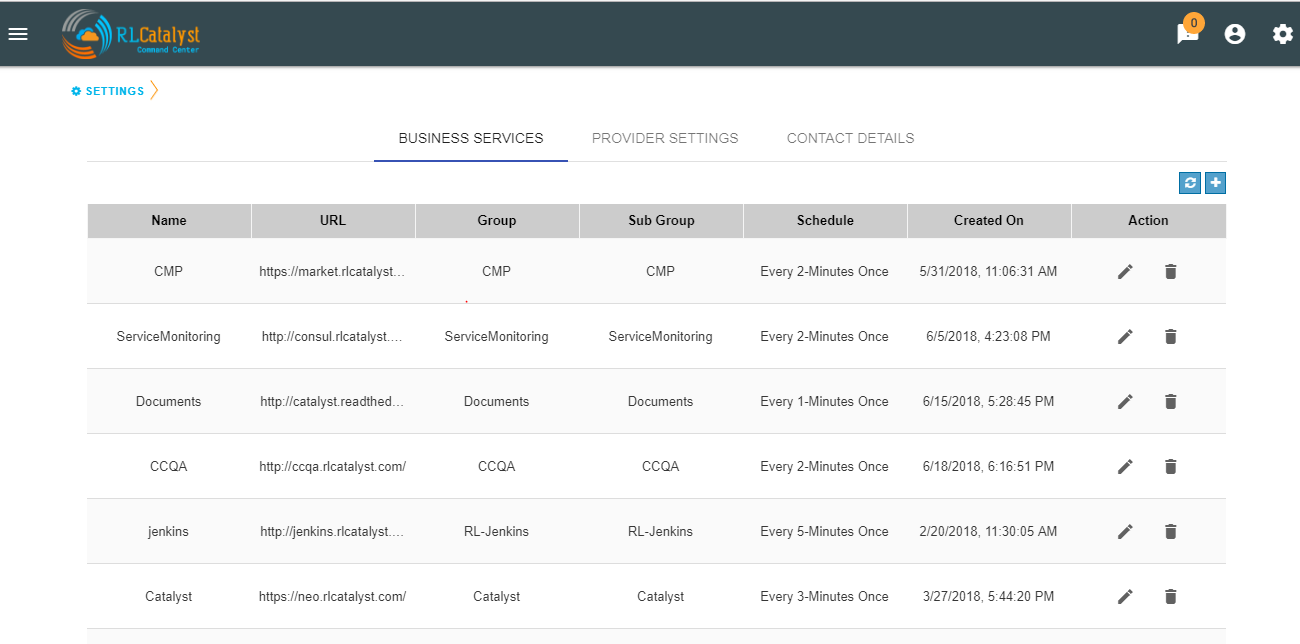
Configuring Business Services
Add Business Services to be monitored in the dashboard view. Each service added will be monitored in the predefined interval. The Business Services will appear as cards in the dashboard each showing the latest status of the service. Clicking on a card will show you a drill down view of the service with the alerts related to the service and the outage trends. Use the Business Services information captured in Appendix A as you follow the steps below.
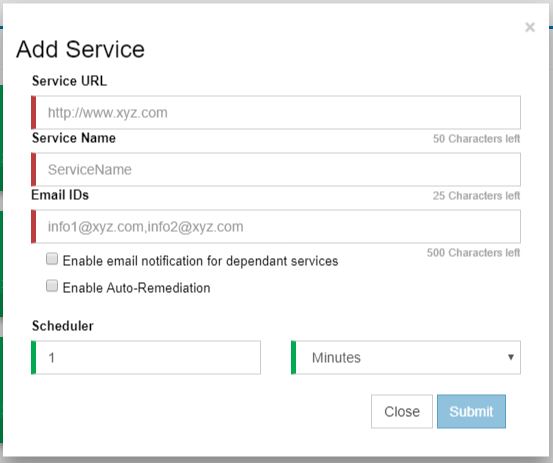
To configure a business service
- Click the + icon in the dashboard view to bring up the Add Service dialog.
- Add the Business Service URL (should be accessible from the Command Centre)
- Enter an alias or a name of the service. This will be the name displayed on the card in the dashboard.
- Provide an email ID to which alerts will be send during Outages. You can provide more than one email ID separated by commas.
- A verification e-mail will be sent to each email ID provided above. Clicking on the link in the email will confirm the email ID for receiving emails.
- Check the box to get email notifications for linked services
Configuring the Catalyst Account
Configuring a Catalyst account allows you to access the summary of BOT runs on your dashboard page. It also enables the Remediation and Auto-Remediation features.
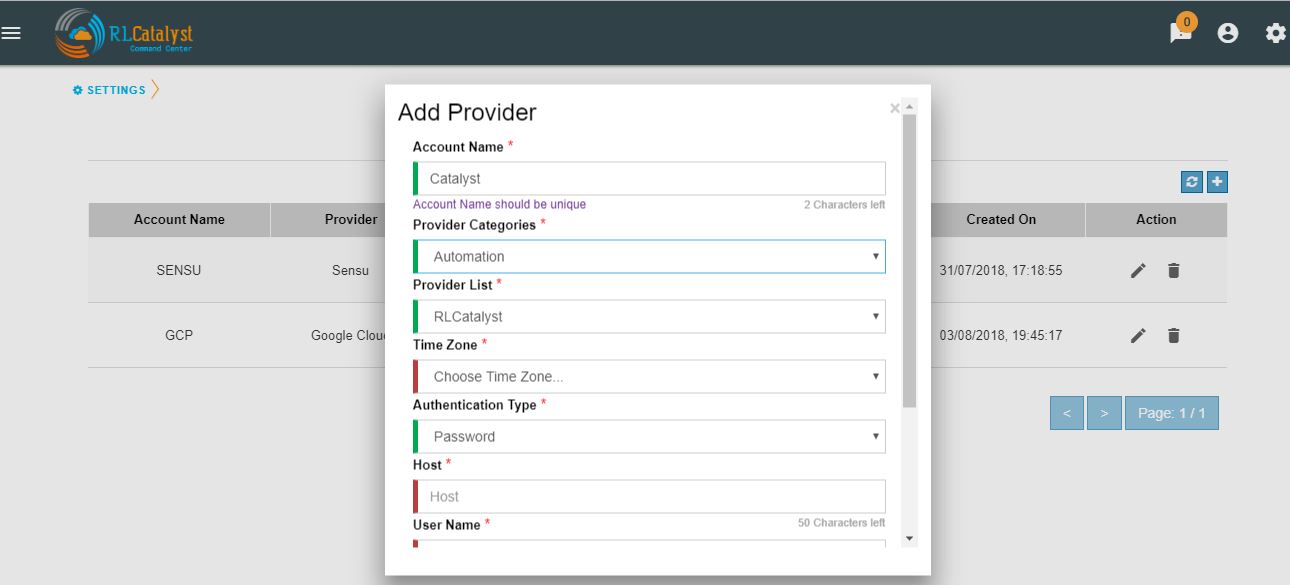
To configure a catalyst account
- Click on the Settings icon in the top bar.
- Click on the Provider Settings tab
- Click + button and add your catalyst account credentials in Settings with the details
| Field | Instructions | |
|---|---|---|
| Account Name | Enter a Friendly name | |
| Provider Categories | Choose Automation | |
| Provider List | Choose RLCatalyst | |
| Time Zone | Choose IST | |
| Authentication Type | Password | |
| Host | URL to your RLCatalyst Instance E.g.:https://neo.rlcatalyst.com/ | |
| UserName | Enter UserName | |
| Password | Enter Password | |
| Schedule | Enter the Time Interval for collecting data from Catalyst | |
| Repeat | Choose the Interval Type-Minutes/Hourly | |
When you add a Catalyst account, BOTs Summary panel will appear on the dashboard.
Installing the Monitoring Agents
RLCatalyst Command Centre uses monitoring agents that run on the individual machines being monitored. Monitoring Agents can be installed manually or via an automated way through RLCatalyst.
Install Agents through RLCatalyst
RLCatalyst installs monitoring agents in the target nodes on which the Business Services are running. This is done via a bootstrapping process which will install system monitoring, app monitoring and services monitoring agents into the instances. Once installed, the real-time monitoring alerts will be available under RLCatalyst Command Centre→Services and RLCatalyst Command Centre→Monitoring Tools.
- Login to <customer name>neo.rlcatalyst.com with the given credentials -> Go to Work zone.
- Click on the tree on the left to choose the Organization, Business Group, Project and
- Environment. By default, there will be
- o Organization with the customer name
- o Business Group ‘DevOps’
- o Project ‘Demo Project’
- o Environments - <customer name>_EVL,
<customer name>_DEV, <customer name>_QA,
<customer name>_PROD, <customer name>_DEVOPS
- Choose one of the environments
- Click on ‘Import’ button. Enter the IP address of the instance, credentials and Import. The agents will be installed automatically when imported.
Note: The checks added for monitoring your services in Consul should be tagged/grouped properly with the business service name that has to be listed in the Dashboard View. RL Team will provide necessary help to get the service checks added
Installing monitoring agents on a Linux machine using a downloaded script Note: Perform the following steps on each machine listed under each Business Service in Appendix A.
Prerequisites
- To configure a machine or VM for monitoring with Command Center the following ports need to be opened in the firewall: 8301 ,8302 ,8500,8600, 3030
- You need sudo privileges to install the clients
- The machine should have a public IP address to communicate with the monitoring servers.
Procedure
- Download the agent_ installation.tar.gz file from the following URL: https://s3.us-east-2.amazonaws.com/cookbookslist/v2.6/linux-agent-installation.zip
| Parameter1 | Service name<A friendly name for the service .This will be your Business Service> |
| Parameter2 | tag application name <Name of this application e.g. MongoDB on which your Business Service depends> |
| Parameter3 | tag tenant id<Company Name for this Tenat> |
| Parameter4 | URL |
| Parameter5 | Checks interval e.g. 60s |
You should now have the monitoring agents running on your machine.
Install monitoring agents on a Windows machine through a downloaded script Note: Perform the following steps on each machine listed under each Business Service in Appendix A
Prerequisites
- To configure a machine or VM for monitoring with Command Center the following ports need to be opened in the firewall: 8301 ,8302 ,8500,8600, 3030
- You need to run PowerShell as Administrator (right-click and choose “Run As Administrator”)
- The machine should have a public IP address to communicate with the monitoring servers.
Procedure
- Download the agent_ installation.tar.gz file from the following URL: https://s3.us-east-2.amazonaws.com/cookbookslist/v2.6/windows-agent-installation.zip
Install monitoring agents on a Windows machine manually
Prerequisites
- To configure a machine or VM for monitoring with Command Center the following ports need to be opened in the firewall: 8301 ,8302 ,8500,8600, 3030
- You need Administrator privileges to install the clients
- The machine should have a public IP address to communicate with the monitoring servers.
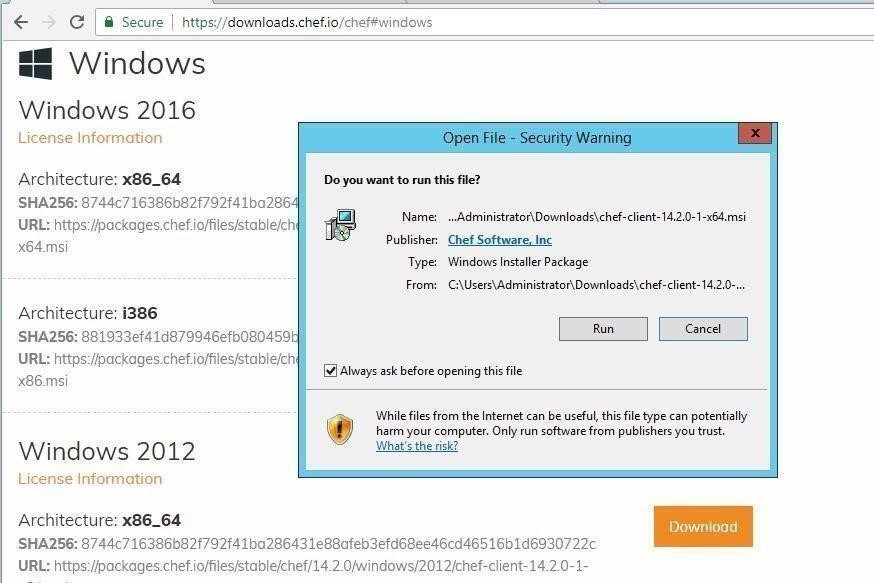
Procedure
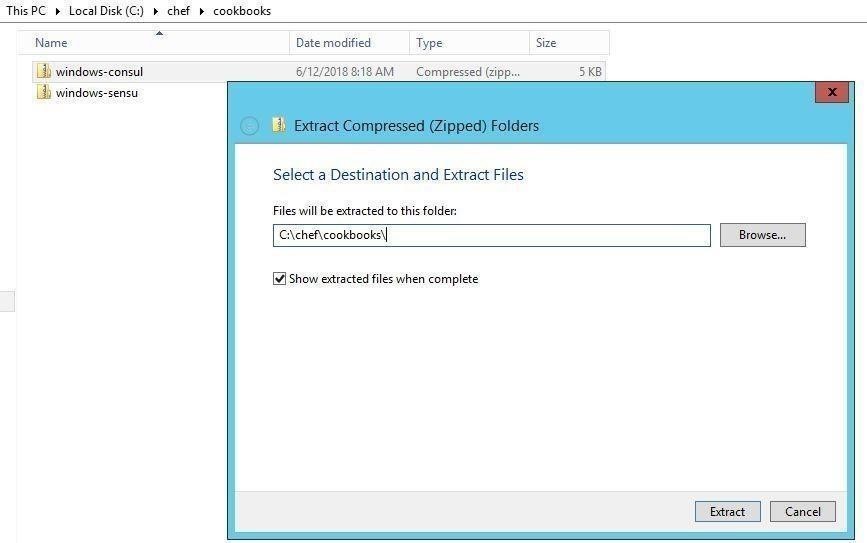
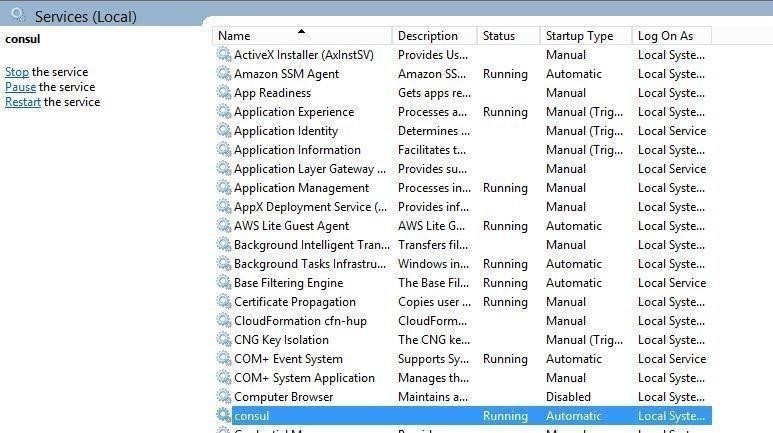
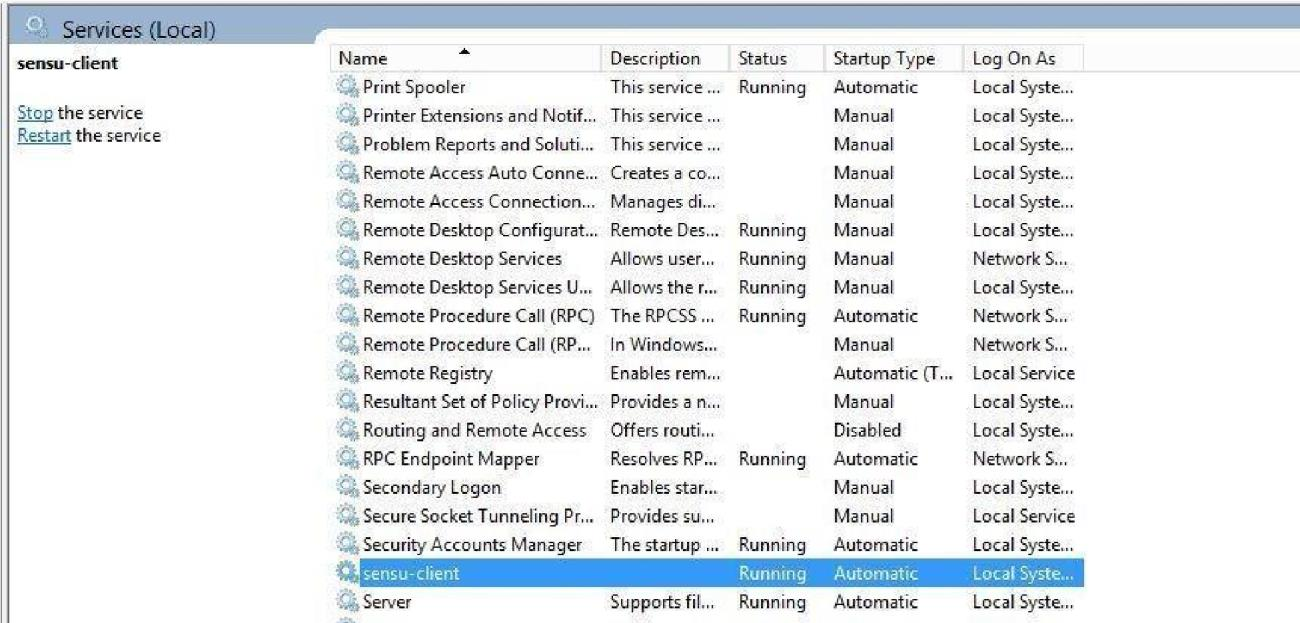
- Choose the Chef Windows package based on the Operating System (Ex: Windows 2012) & Architecture (Ex: X86_64) from the below link in the required/available windows machine https://downloads.chef.io/chef#windows
Install monitoring agent(Zabbix) on a Ubuntu machine manually
Procedure
Zabbix apt repositories are available on Zabbix official website. Add the repository to install required packages for Zabbix agent using the following command wget http://repo.zabbix.com/zabbix/3.4/ubuntu/pool/main/z/zabbix-release/zabbix-release_3.4-1%2Bbionic_all.deb
- Un-zip the downloaded file using following command
dpkg -i zabbix-release_3.4-1+trusty_all.deb
- As you have successfully added Zabbix apt repositories in your system let’s use the following command to install Zabbix agent using the following command
sudo apt-get update sudo apt-get install zabbix-agent
- After installation of Zabbix agent. Edit Zabbix agent configuration file /etc/zabbix/zabbix_agentd.conf and update Zabbix server IP.
#Server=[zabbix server ip] #Hostname=[Hostname of client system ]
Server=192.168.1.10 Hostname=Server2
Here 192.168.1.10 is the IP of Zabbix server to allow for connection with this Zabbix client.
- After adding Zabbix server IP in the configuration file, now restart agent service using below command.
sudo systemctl start zabbix-agent